This topic contains a solution. Click here to go to the answer
|
|
|

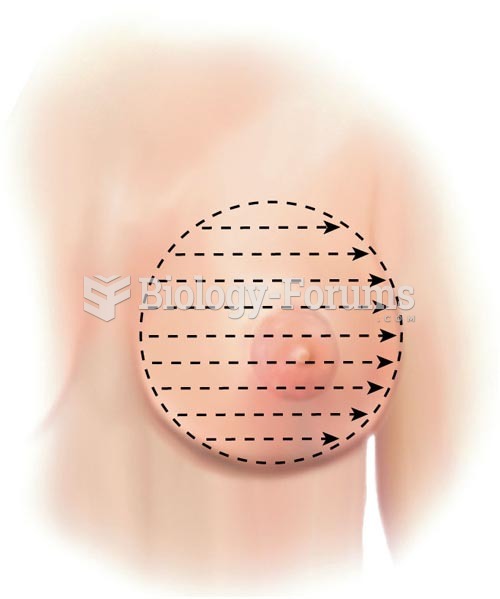 Breast Palpation Methods, Parallel Lines
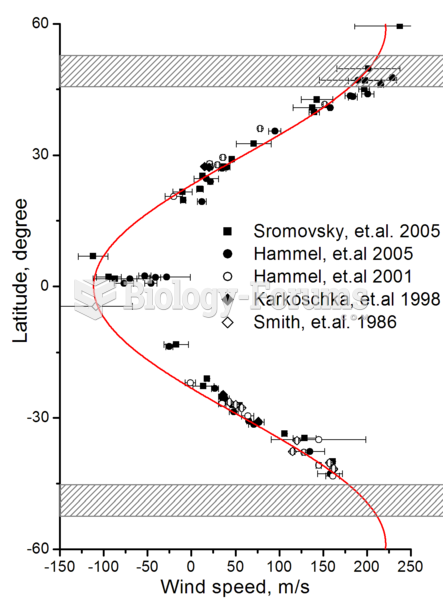 Zonal wind speeds on Uranus. Shaded areas show the southern collar and its future northern counterpa
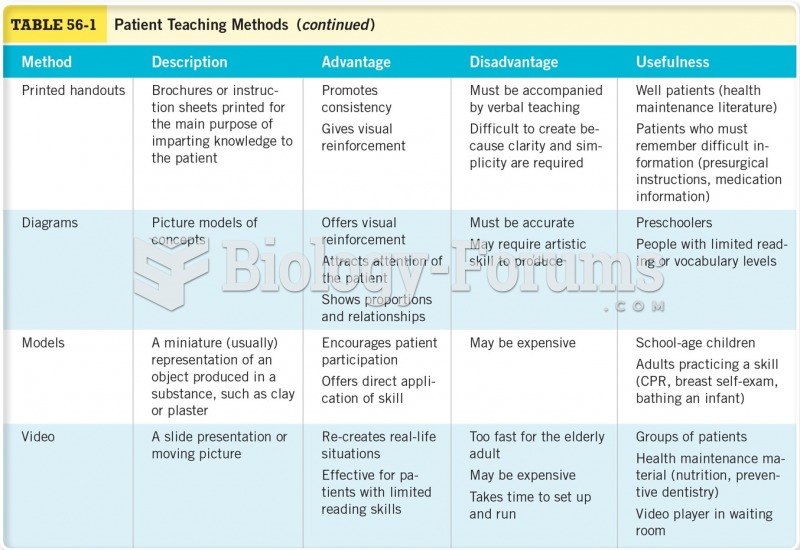 Patient Teaching Methods Cont.
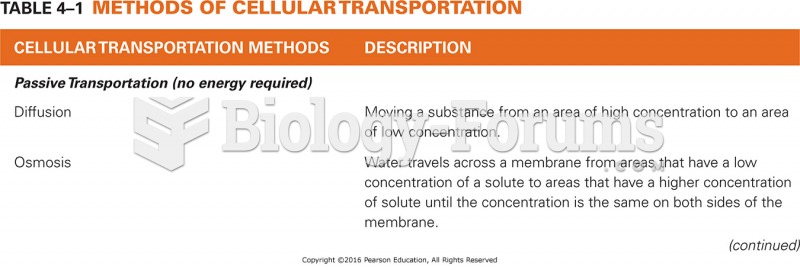 Methods of Cellular Transportation
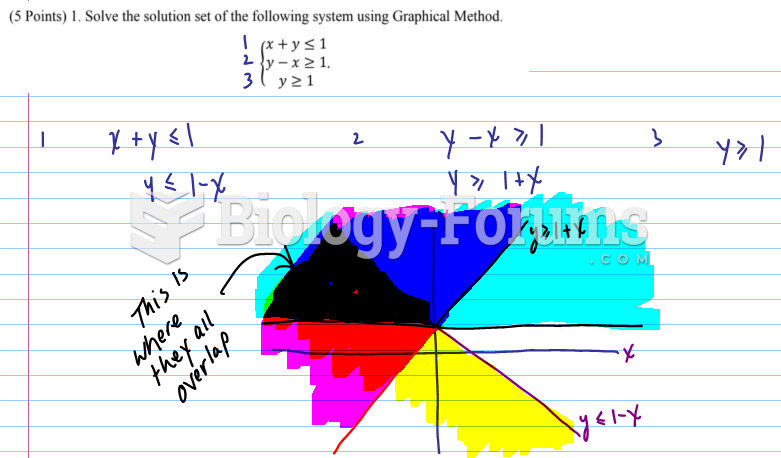 Solve the solution set of the following system using Graphical Method.
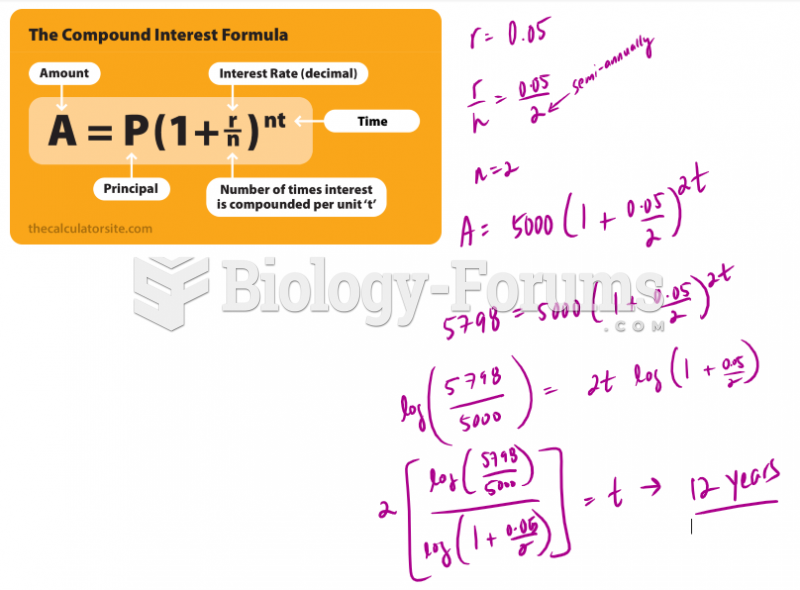 Use a graphical method to find the length of the loan to the nearest year