This topic contains a solution. Click here to go to the answer
|
|
|

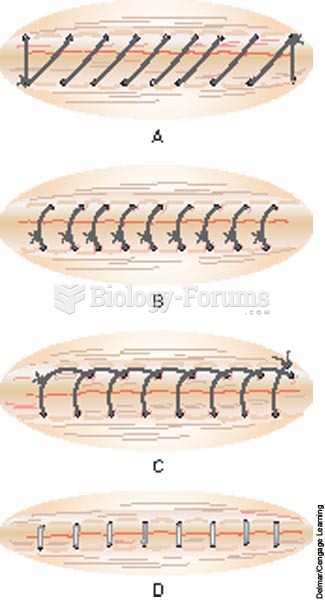 Skin closure methods
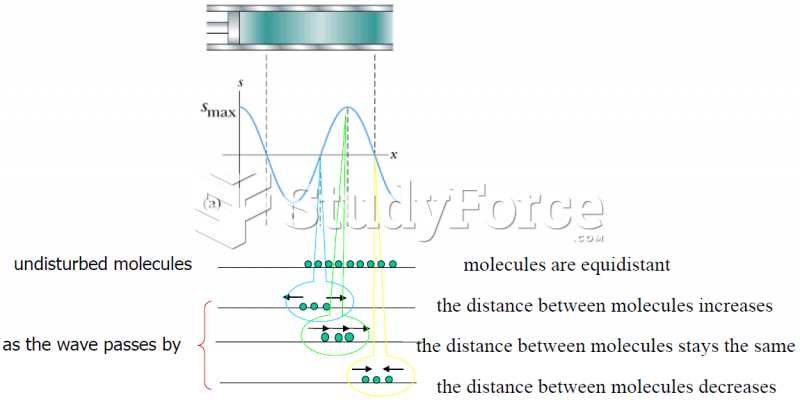 Graphical representation of a sinusoidal longitudinal wave
 Popular Methods of Conducting Social Science Research
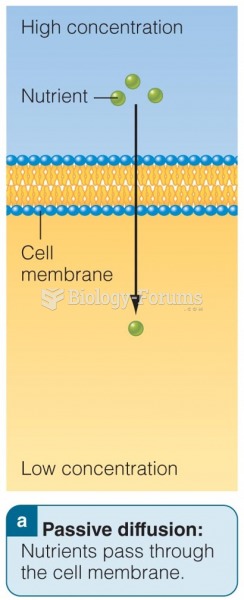 Absorption Methods in the Intestine
 Demographic Data for Nigeria
 data
data