This topic contains a solution. Click here to go to the answer
|
|
|

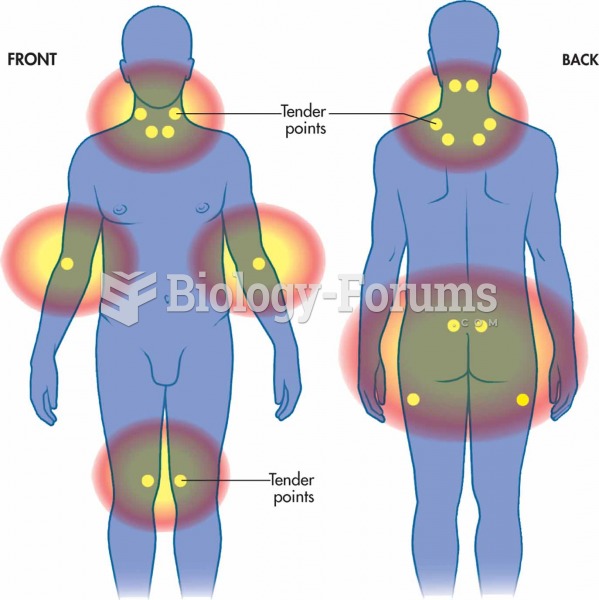 The 18 tender points of fibromyalgia
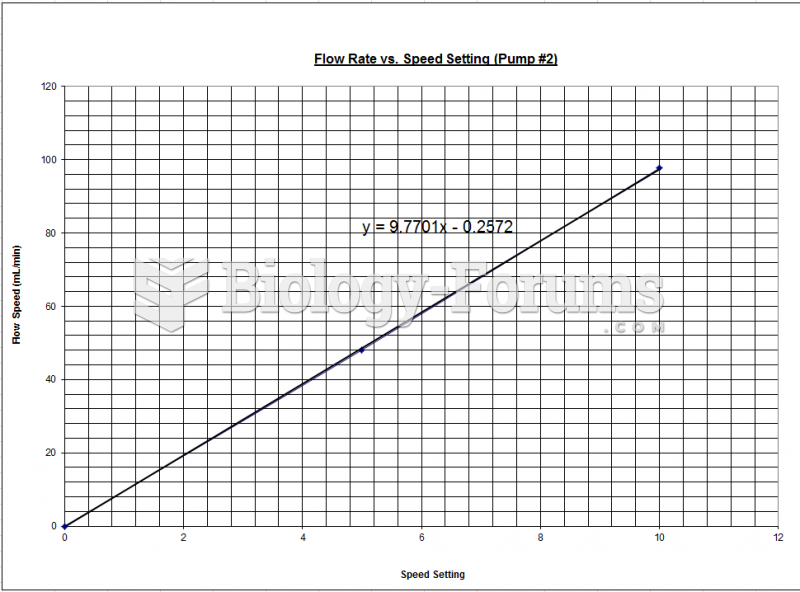 Fluidization - Chart Pump #2
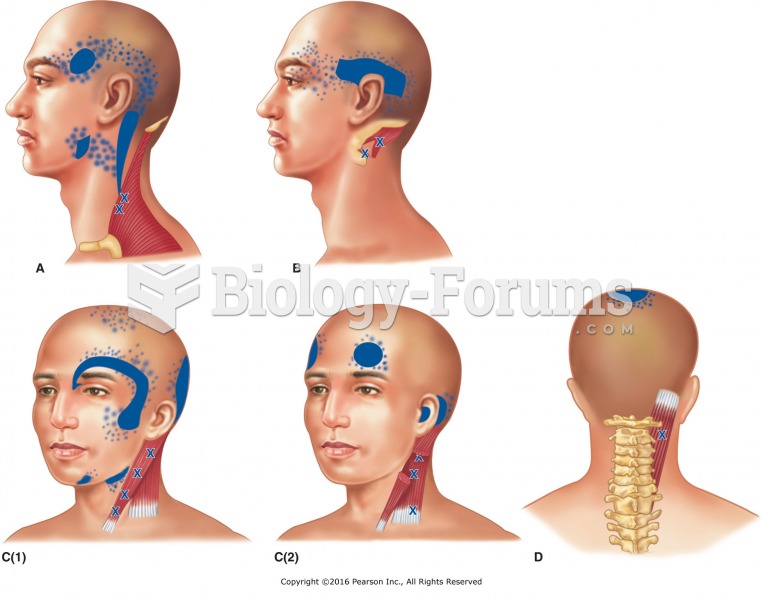 Locations and reference zones of trigger points that cause headaches. A. Upper trapezius. B. ...
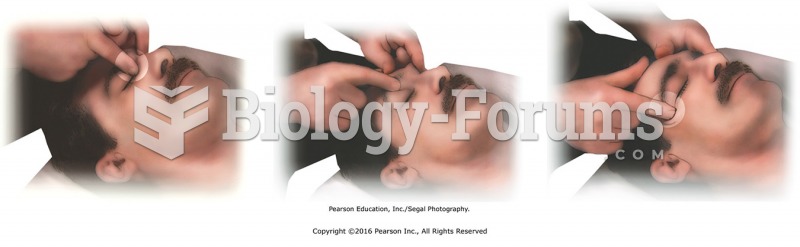 Press Bladder meridian points along upper orbital ridge with fingertips, from B-1 on the inside ...
 qPCR Efficiency Chart
 Linear programming problems using the simplex method.