|
|
|

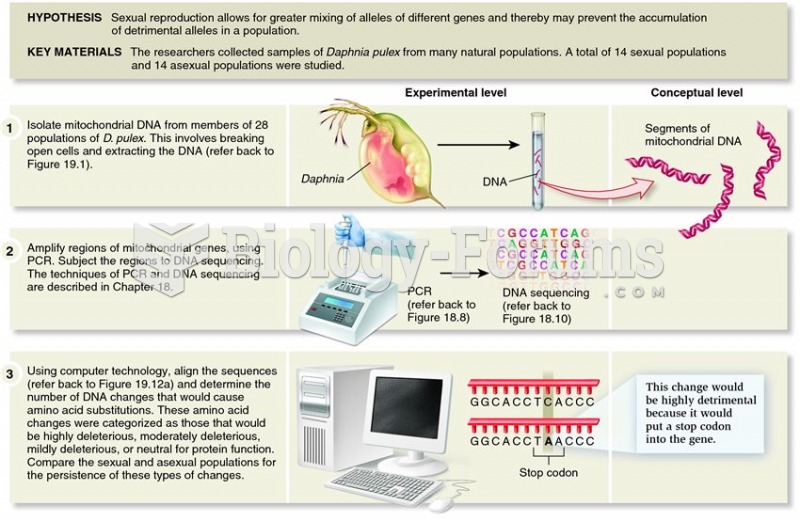 Paland and Lynch demonstrated the importance of sexual reproduction in reducing the frequency of mal
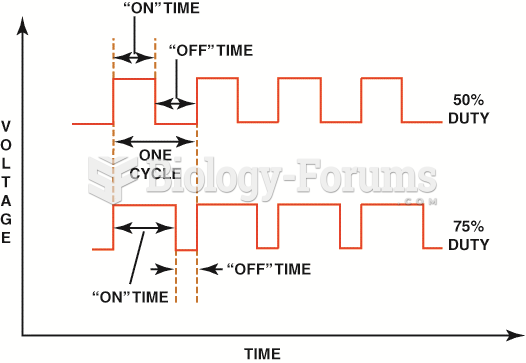 Both the top and bottom pattern have the same frequency. However, the amount of on-time varies.
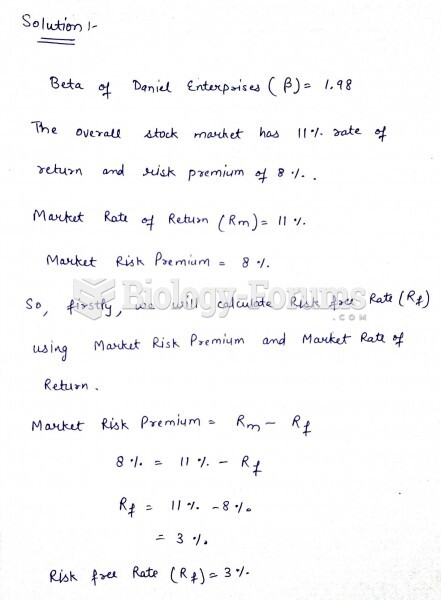 Daniel's Enterprises has a beta of 1.98 and a growth rate of 12 percent. The stock is ...
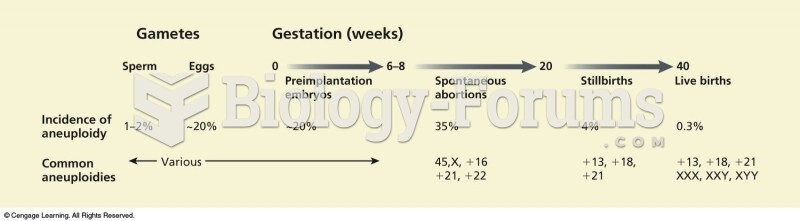 The frequency of aneuploidy changes dramatically over developmental time. Between 6 to 8 weeks and 2
 If the frequency equals 60 Hz in Figure 10-1, what is the value of capacitance?
 The consequences of the intensity of natural selection on allele frequency.