This topic contains a solution. Click here to go to the answer
|
|
|

 The physician uses percussion—tapping—to detect sound or vibration.
 How to solve a linear system when the terms are fractions
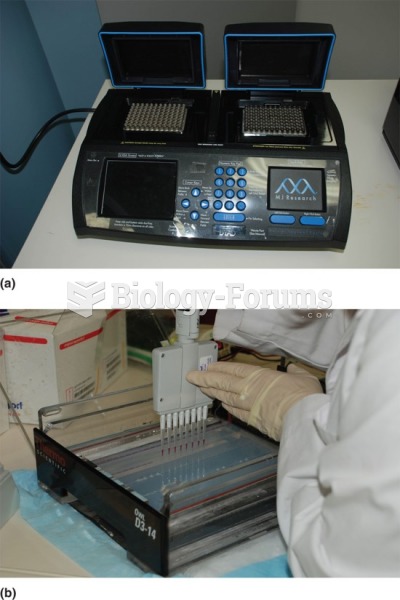 a) Standard PCR machine used for genotyping and (b) agarose gel to detect DNA fragments.
 Ethical Principles Regarding Relationships with Classmates
 How to classify whether an equation is linear, quadratic, or cubic
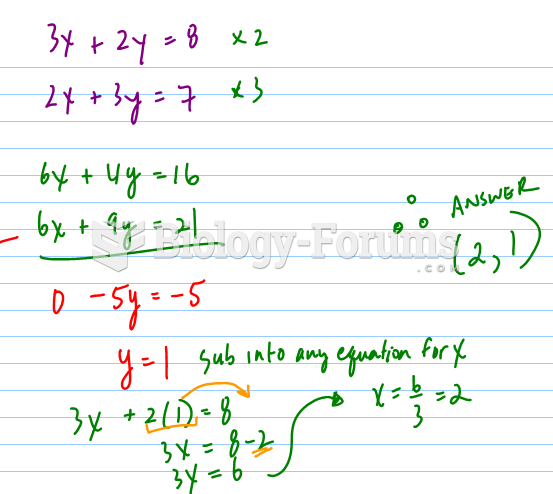 Elimination, System of Linear Equations