This topic contains a solution. Click here to go to the answer
|
|
|

 Evolutionary relationships of the fungi
 Bacteriophage double-strand DNA (linear)
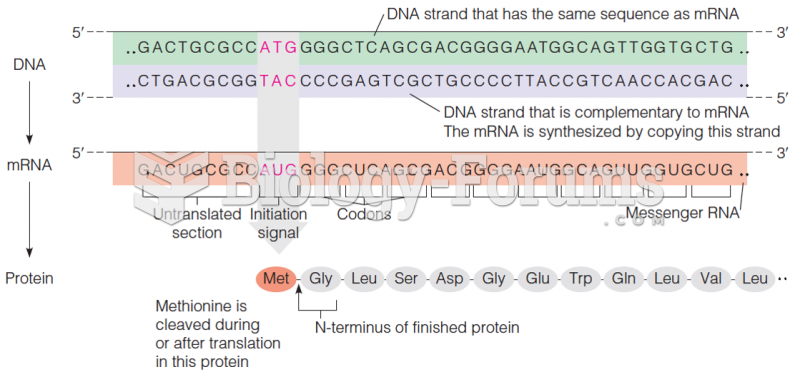 Relationships of DNA to mRNA to polypeptide chain
 Linear lesions
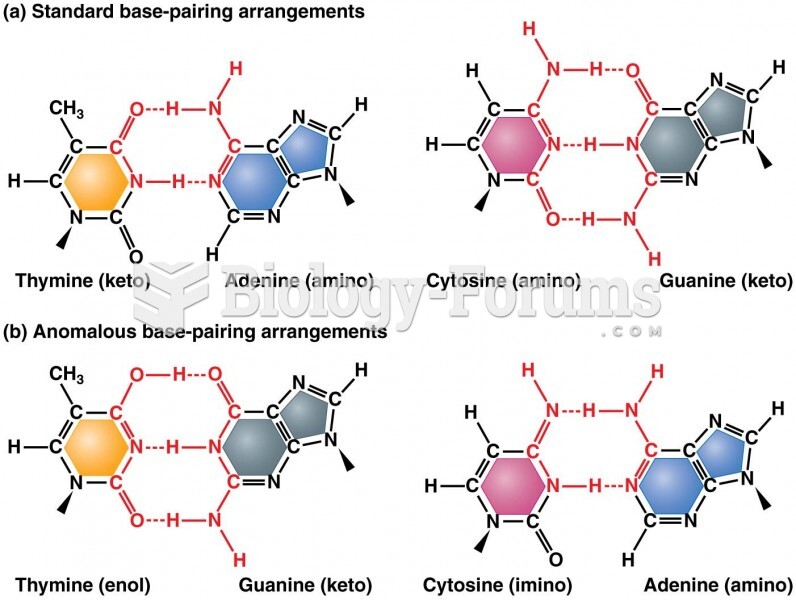 Standard base-pairing relationships
 Solution to linear and parabola