This topic contains a solution. Click here to go to the answer
|
|
|

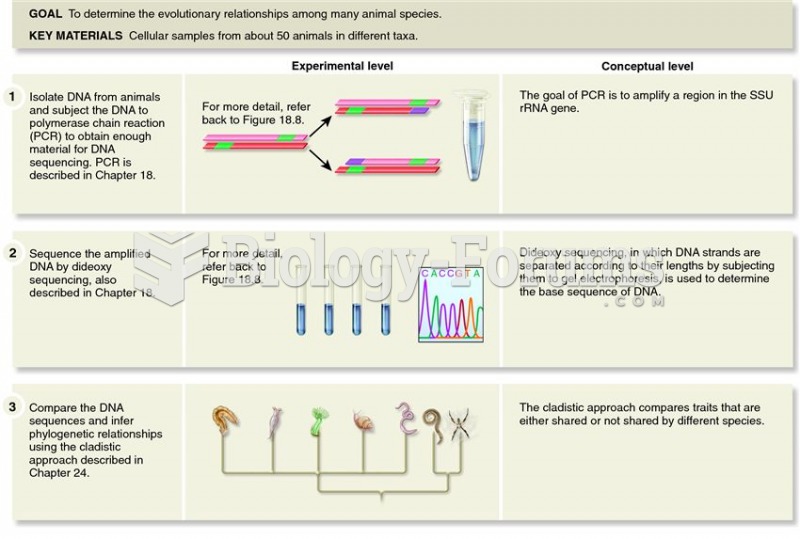 Approach used to determine the evolutionary relationships among many animal species using molecular
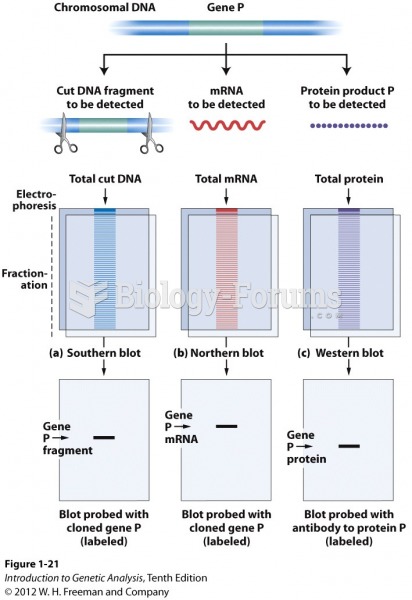 Probes can be used to detect specific macromolecules
 Three possible phylogenies for the australopithecines with Au. anamnesis as the stem ancestor and re
 Carbon dioxide. This molecule exhibits a nonpolar bond and results in a linear and symmetrical ...
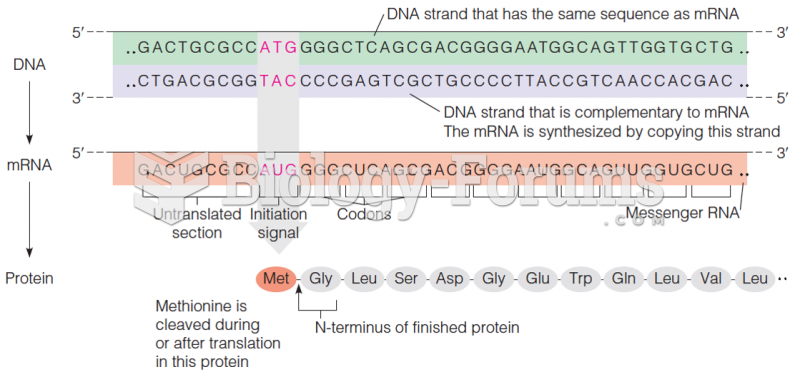 Relationships of DNA to mRNA to polypeptide chain
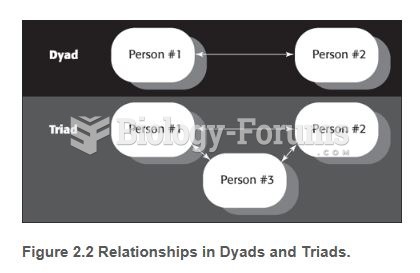 Relationships in Dyads and Triads