This topic contains a solution. Click here to go to the answer
|
|
|

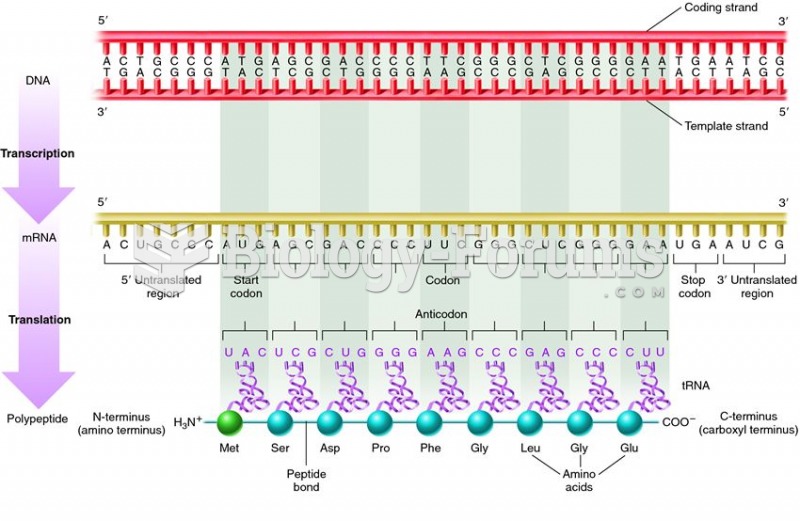 Relationships among the coding sequence of a gene, the codon sequence of an mRNA, the anticodons of
 Symbolic language may have helped reinforce exclusive sexual relationships within social groups in l
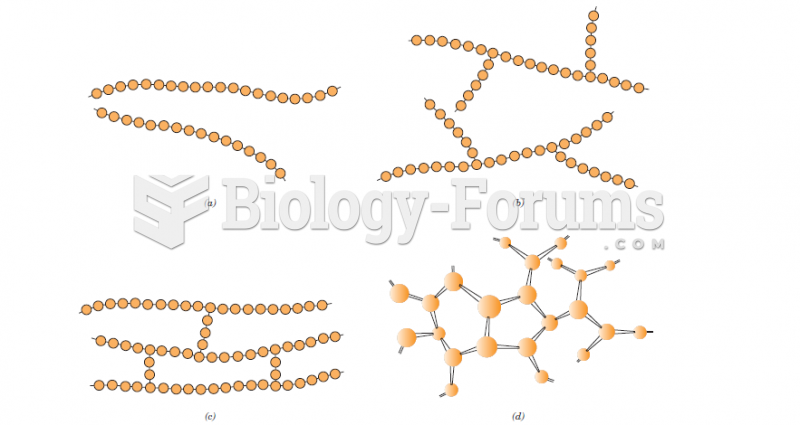 Schematic representations of (a) linear, (b) branched, (c) crosslinked, and (d) network (three-dimen
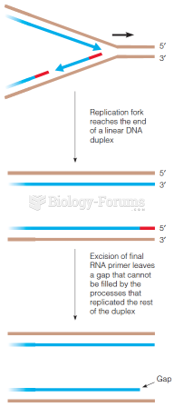 The problem of completing the 5 end in copying a linear DNA molecule
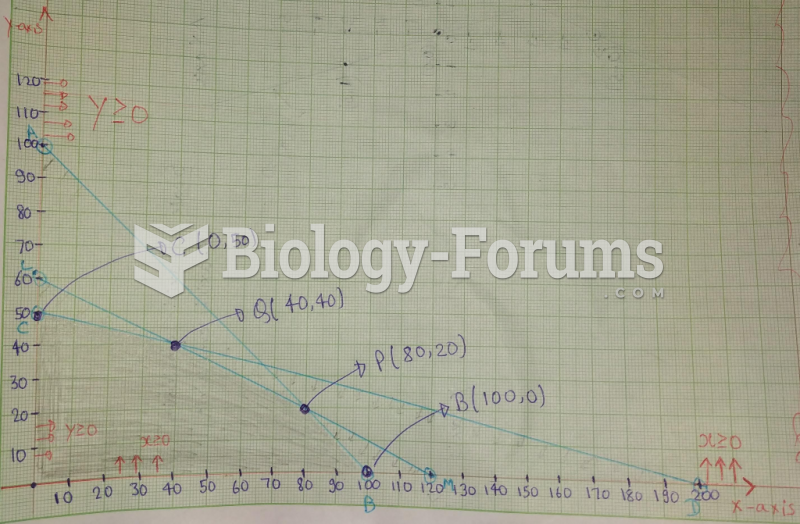
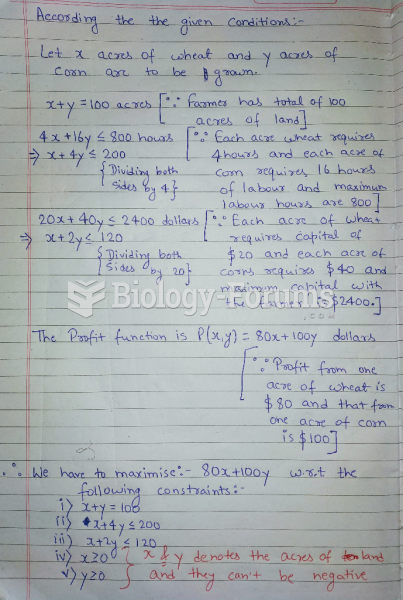 Linear programming problems using the simplex method.
 Linear programming problems using the simplex method.