|
|
|

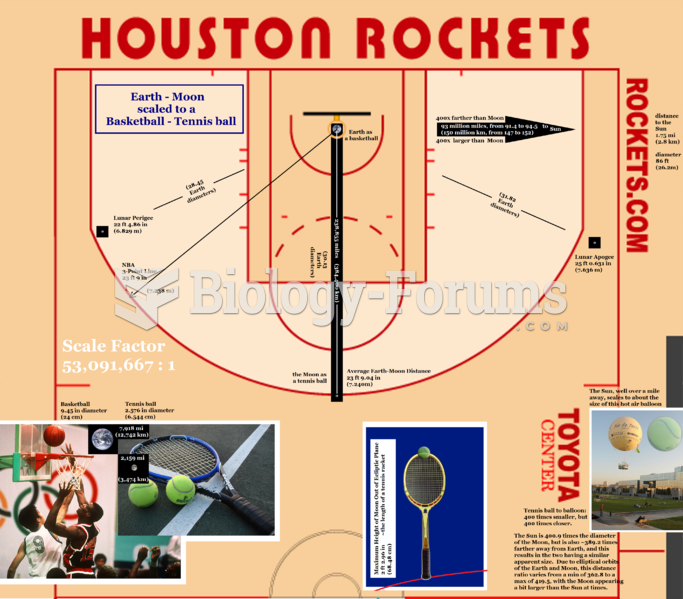 Scaling the Earth down to the size of a basketball, the Moon is roughly the size of a tennis ball. T
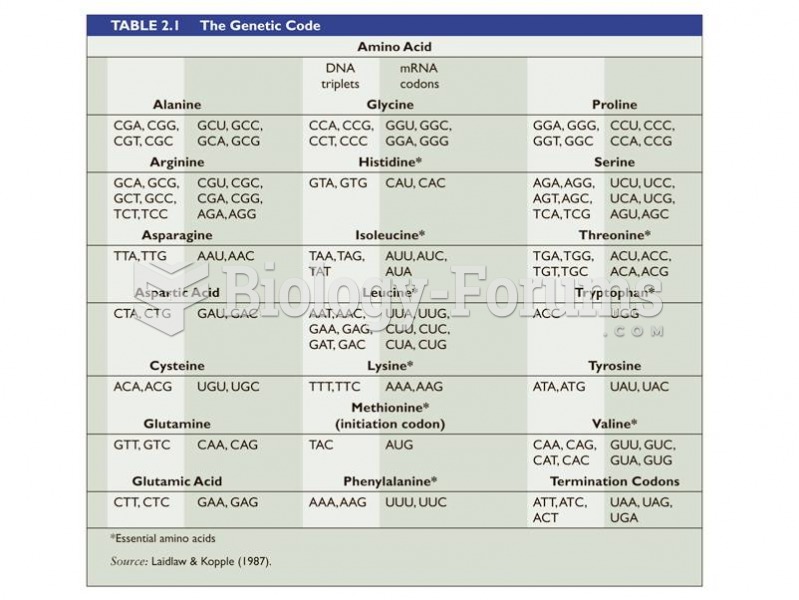 Amino acids chart
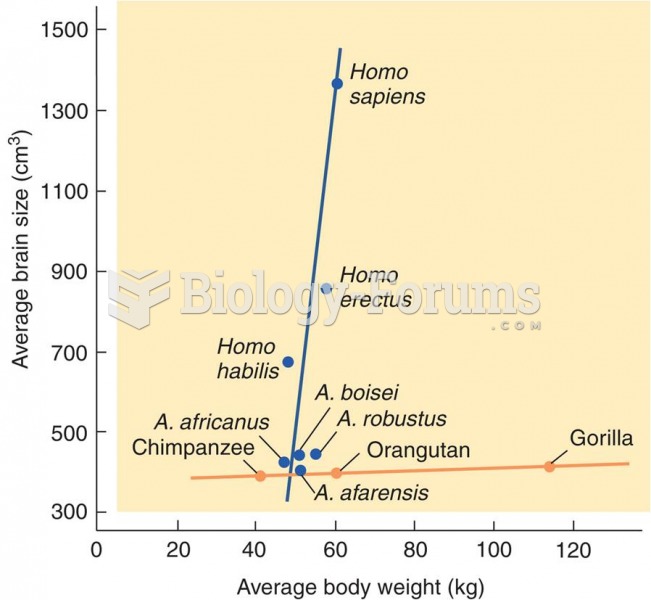 Hominid Brain Size
 Does Intelligence Increase with Brain Size?
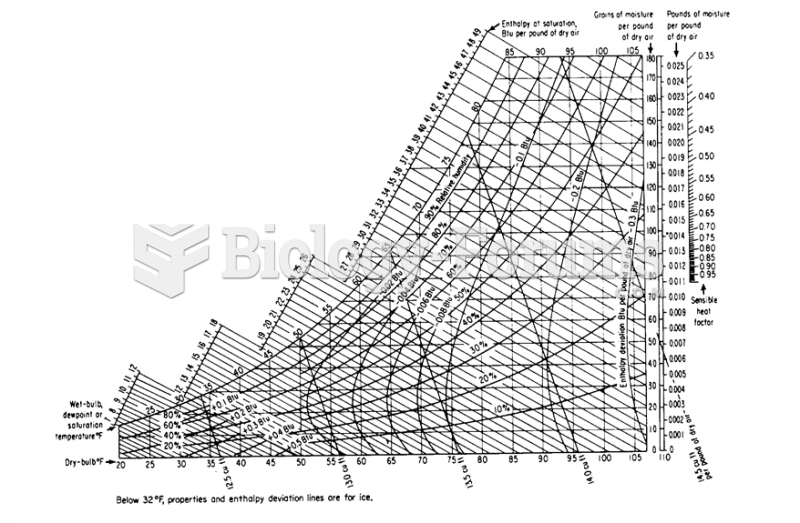 Humidity Chart
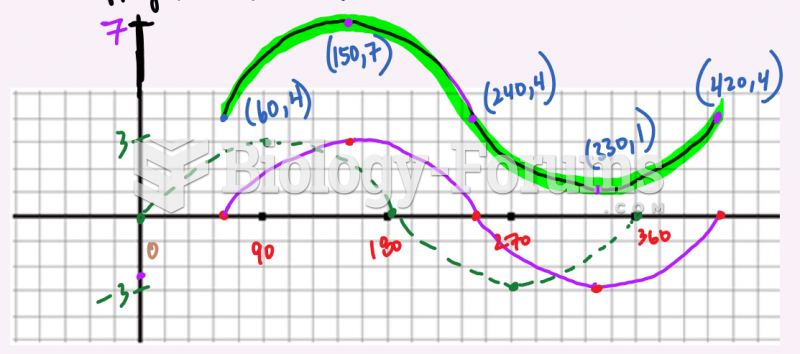 State the amplitude, period, equation of the axis, and maximum and minimum value