|
|
|

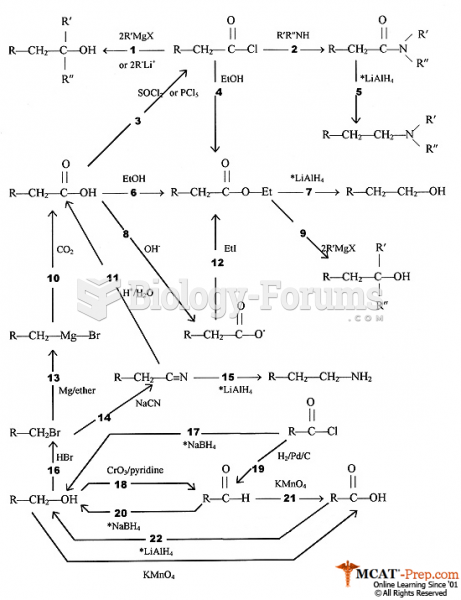 Organic Synthesis Flow Chart
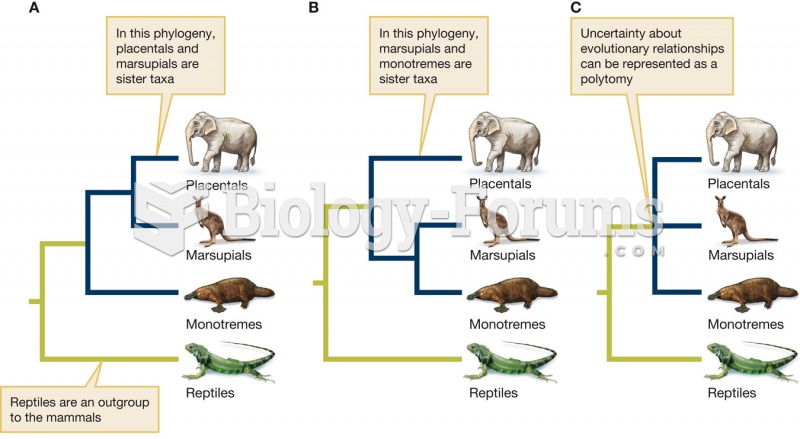 Polytomies represent uncertainty about phylogenetic relationships
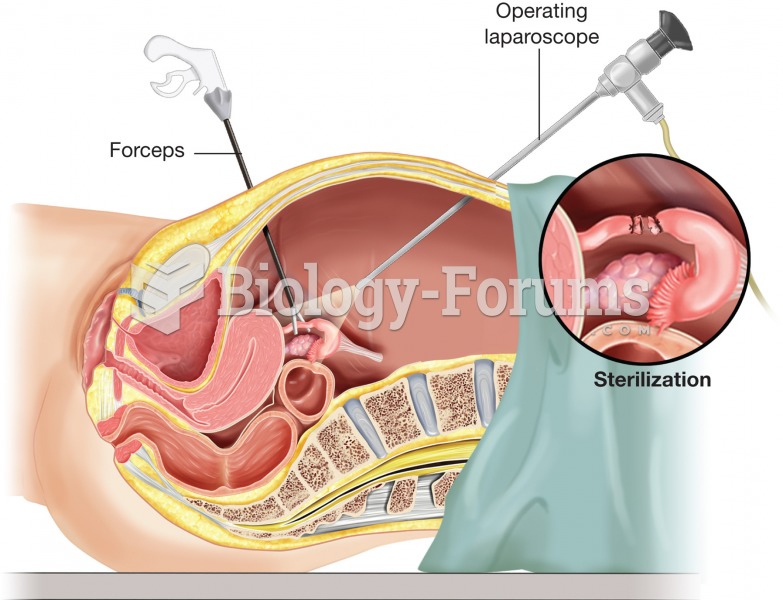 Tubal ligation. To minimize the size of the incisions necessary, laparoscopic surgery may be used to
 Scale used to measure pupil size in millimeters.
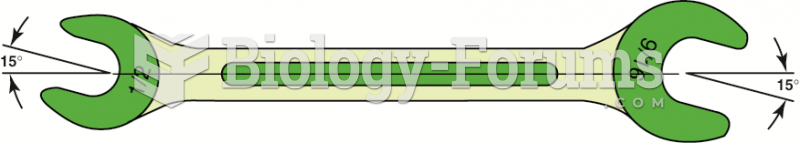 A typical open-end wrench. Note the size difference on each end and that the head is angled 15 ...
 Bio Chart