|
|
|

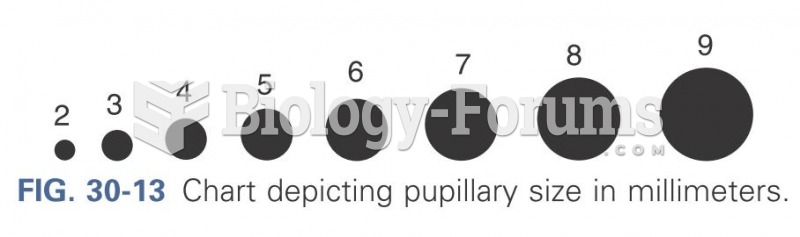 Chart depicting pupillary size in millimeters
 Australopithecus sediba shares small brain size with other members of Australopithecus but also has
 This chart illustrates the bottom up assumption about government. In this, attitudes, culture, and
 Urine sediment chart.
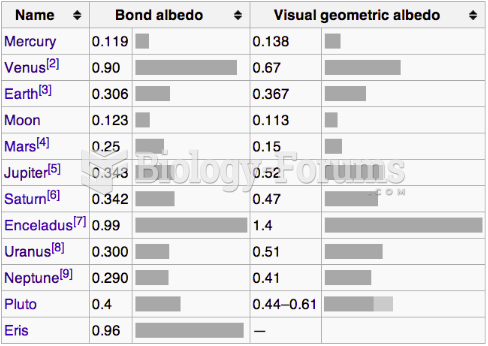 Albedo Chart
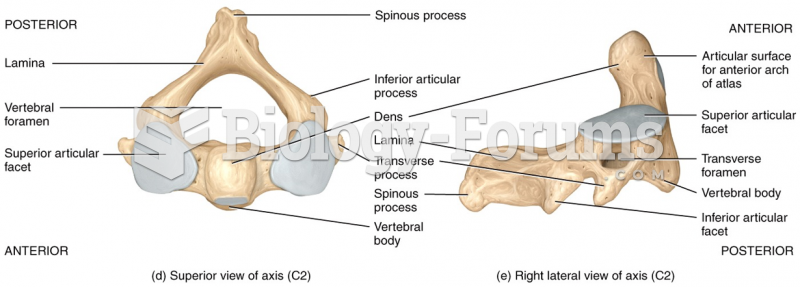 Superior view of axis and right lateral view of axis