|
|
|

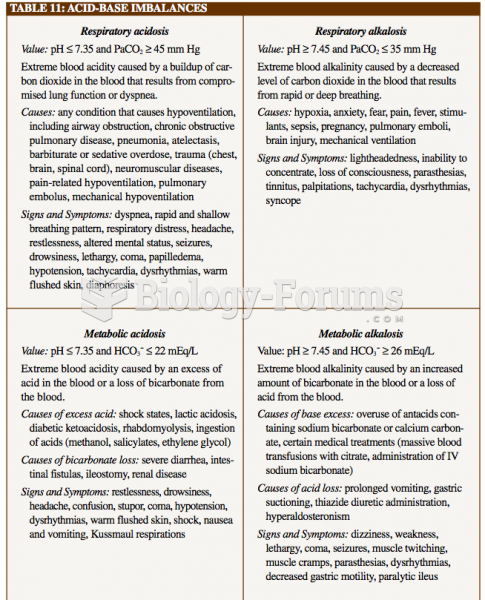 ABG chart
 China's proposed supercollider plans to be twice the size of the Large Hadron Co
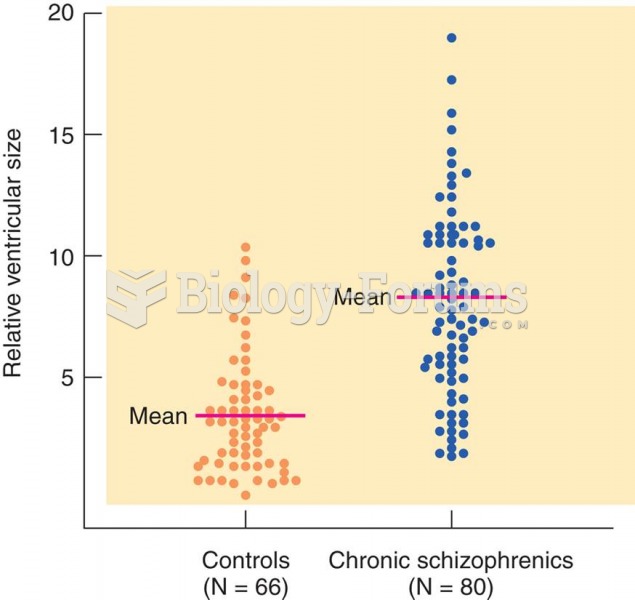 Relative Ventricular Size in Chronic Schizophrenics and Controls
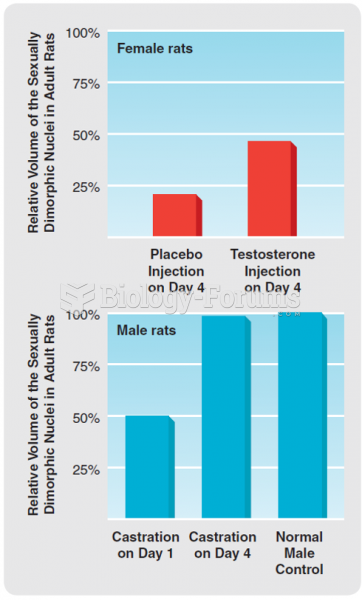 The effects of neonatal testosterone exposure on the size of the sexually dimorphic nuclei in male ...
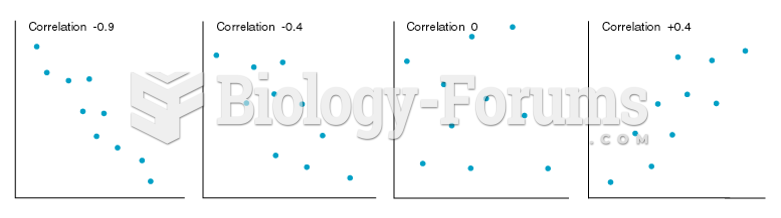 Scatterplots of Variables Having Several Different Levels of Correlation
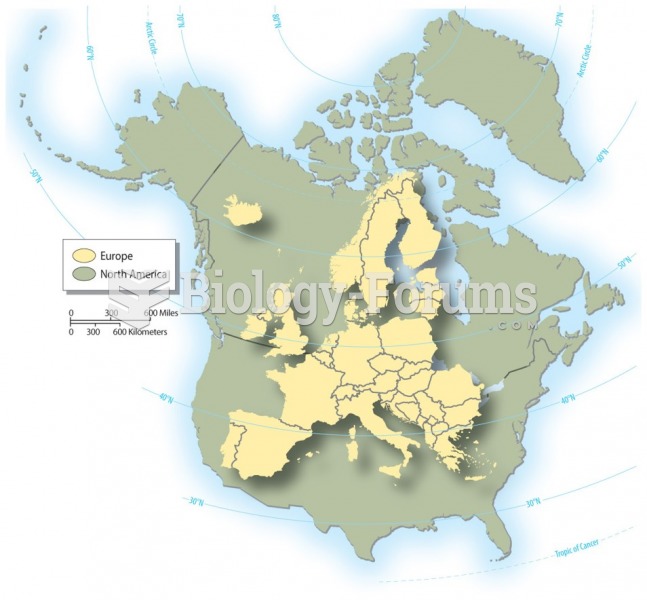 Europe’s Size and Location