|
|
|

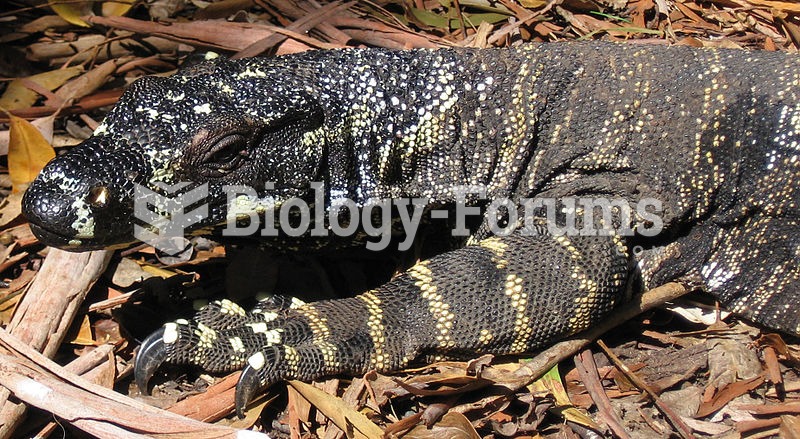 Lace Monitor (Varanus varius)
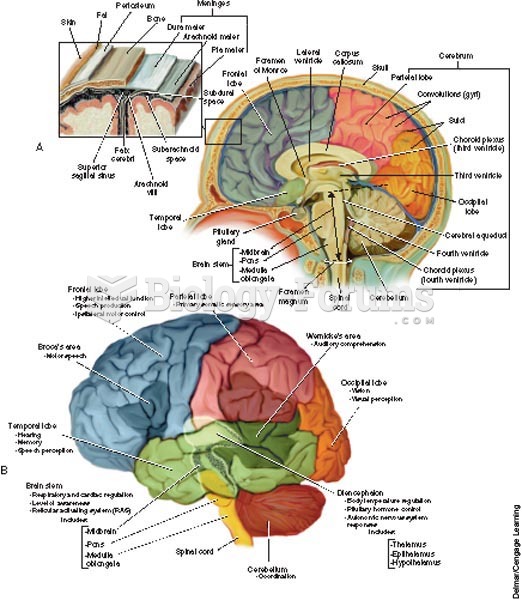 The central nervous system
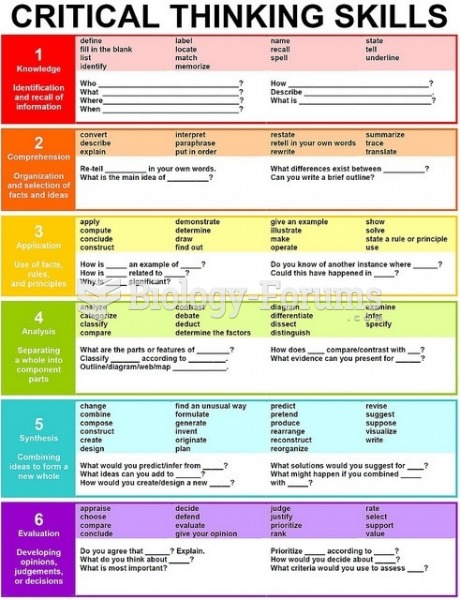 Critical Thinking Skills chart
 Despite the traditional focus on males, females actively choose mates and are the driving force in t
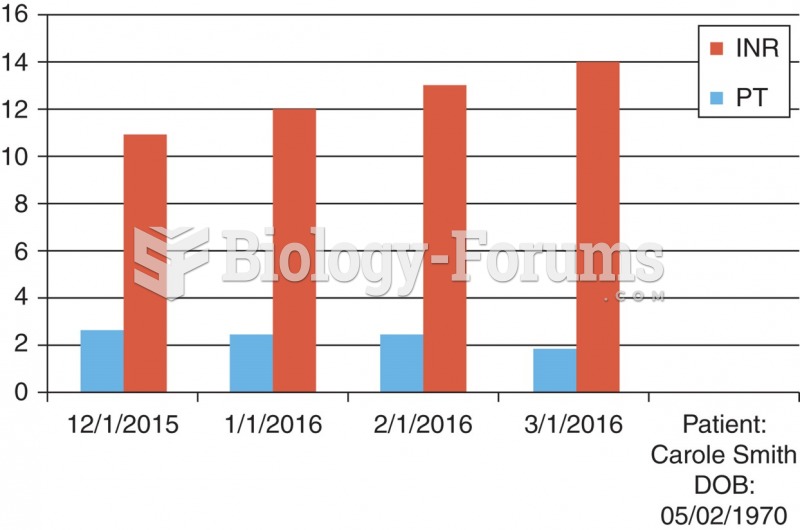 A chart derived from a flow sheet.
 Sample time management planning chart for a massage student.