|
|
|

 Successful agriculturalists must have a basic understanding of landscape structure and process. Thes
 A lace monitor (Varanus varius) in Byfield National Park
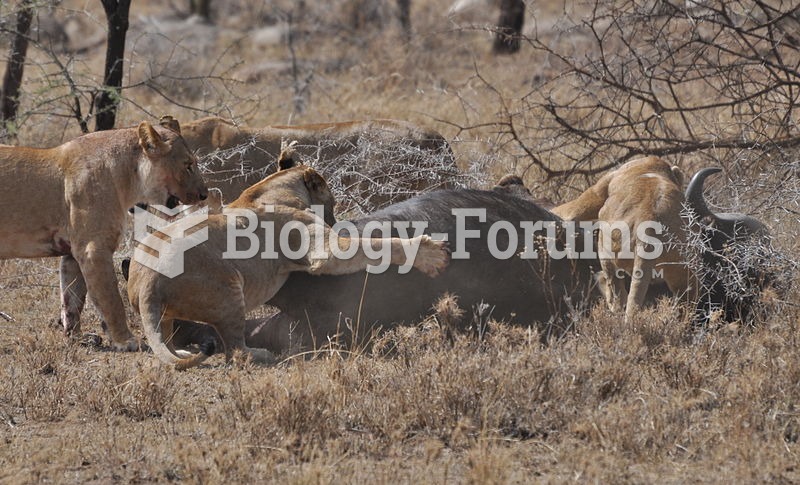 Four lions take down a cape buffalo in the central Serengeti, Tanzania
 Children with disabilities used to be sent to special schools. In a process called mainstreaming or ...
 Major Degenerative Diseases of the Central Nervous System
 Condyle process