|
|
|

 During the Pullman strike in Chicago, workers protesting wage cuts did $340,000 in property damage,
 Central Tendency in Symmetrical Distributions
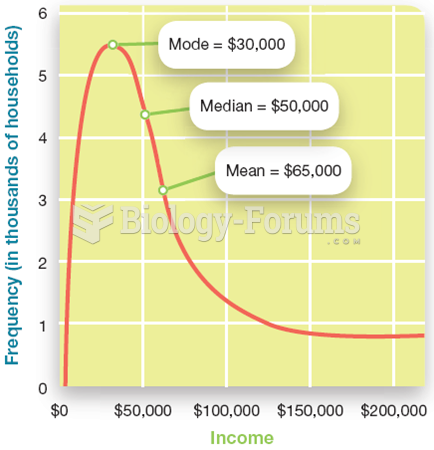 Central Tendency in Skewed Distributions
 Three Phases of the Tissue/Wound Repair Process.
 Albedo Chart
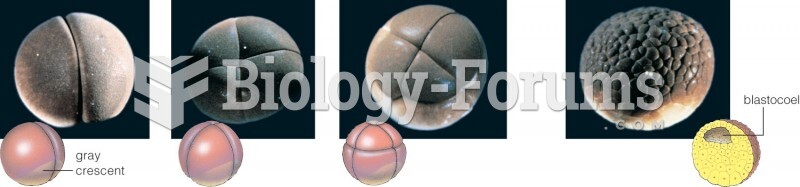 Here we show the first three divisions of cleavage, a process that carves up a zygote’s cytoplasm. ...