|
|
|

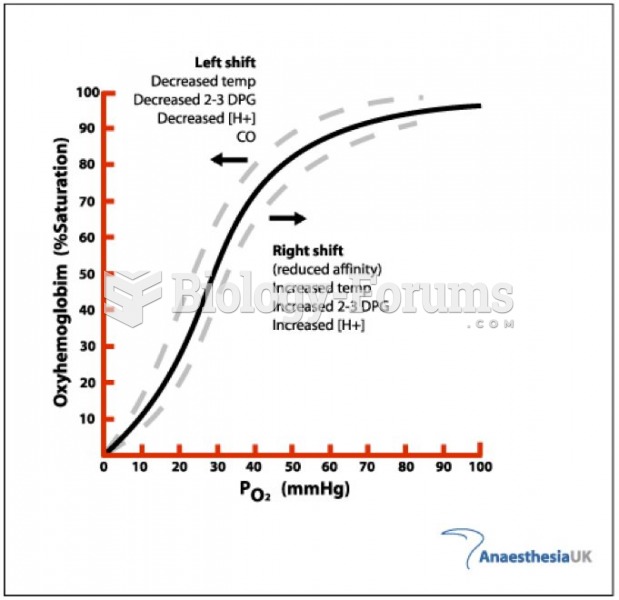 Oxygen dissociation curve
 Bell Curve Joke
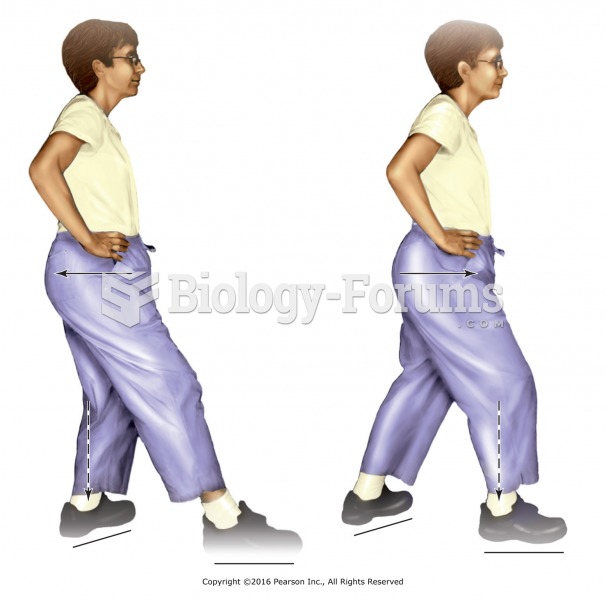 Tai chi stance with front foot pointing straight ahead and back foot at 45° angle, heels in line, ...
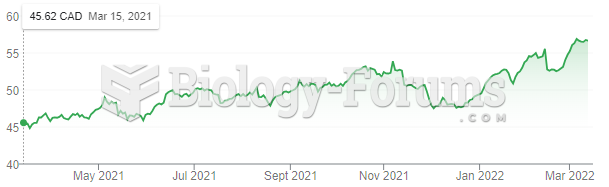 Discuss the trend you notice about enbridge inc
 The forked-line method for determining gamete genotype frequency
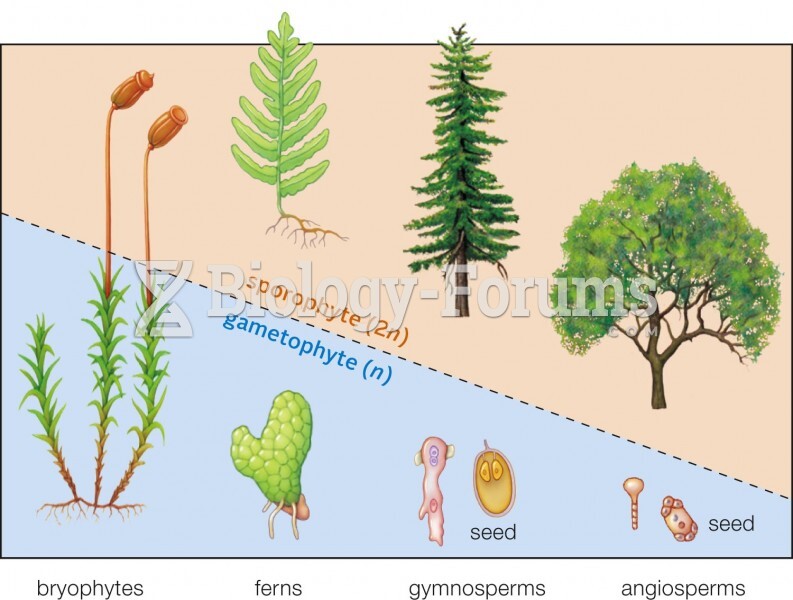 Evolutionary trend in plant life cycles