|
|
|

 the comet Encke riding along its pebbly trail of debris (long diagonal line) between the orbits of M
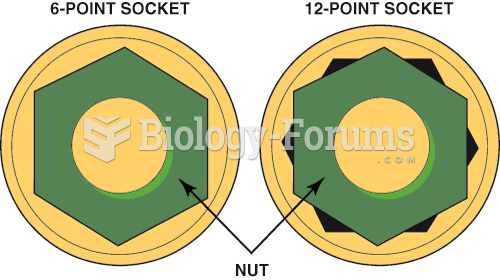 A 6-point socket fits the head of a bolt or nut on all sides. A 12-point socket can round off the ...
 (A) Pinch along jaw line from midline to lateral aspect. (B) Press St-6 at masseter attachment.
 Classic Supply - Demand Curve
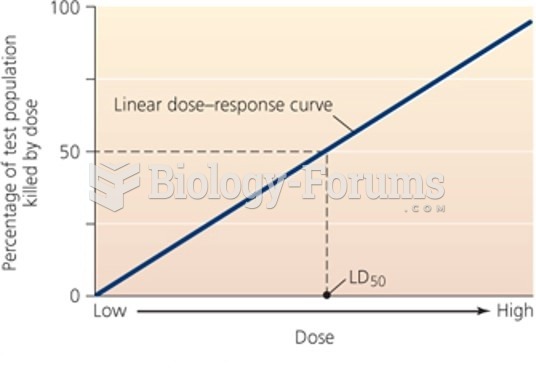 Linear dose-response curve
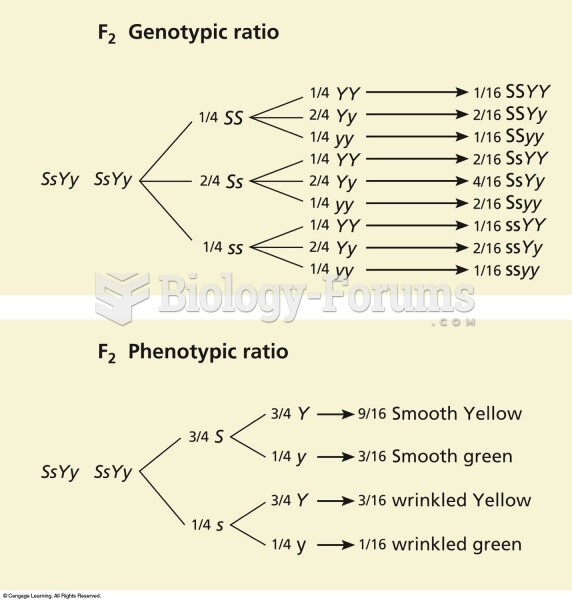 The phenotypic and genotypic ratios of a dihybrid cross can be derived using a branched-line method