|
|
|

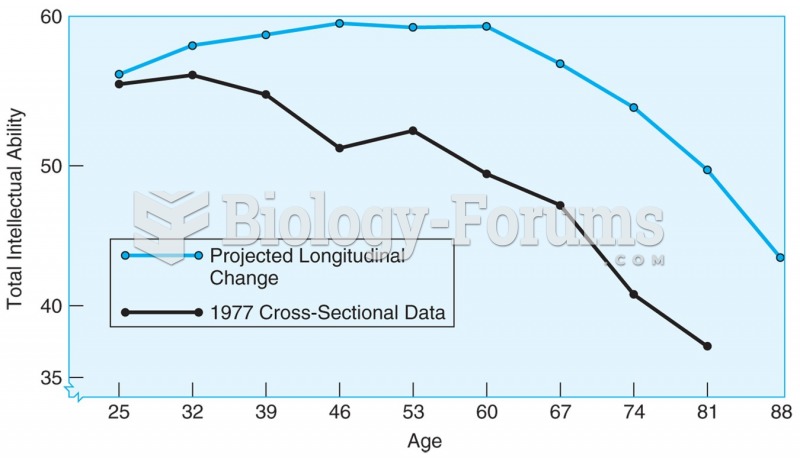 4.1 Age changes in total IQ based on cross-sectional data (lower line) and longitudinal data ...
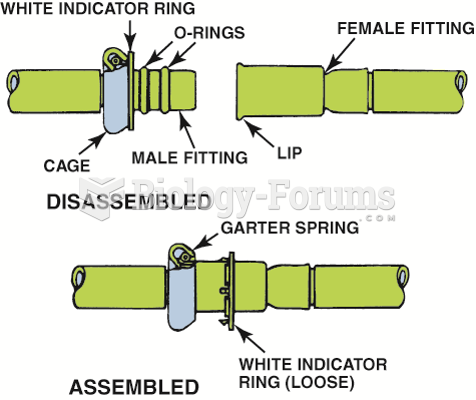 Some Ford metal line connections use springlocks and O-rings.
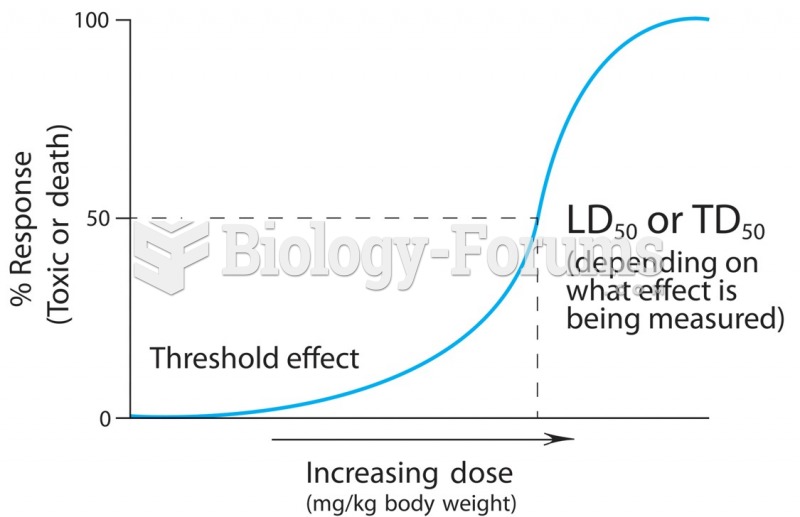 A dose-response curve describes the relationship between the quantity of the chemical entering the ...
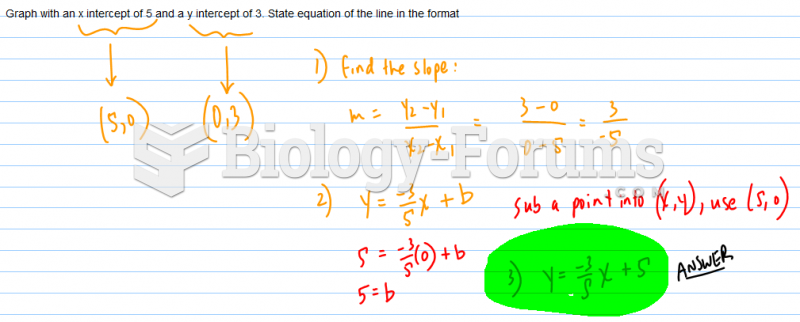 Finding the equation of a line
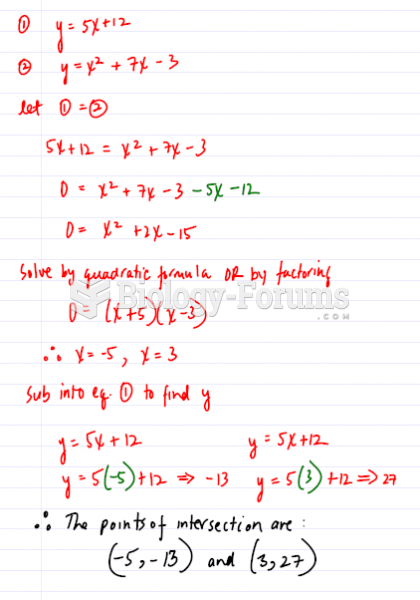 The line with the equation y=5x+12 intersects the parabola with equation y=xsqared+7x-3 at the ...
 Find the curved line