|
|
|

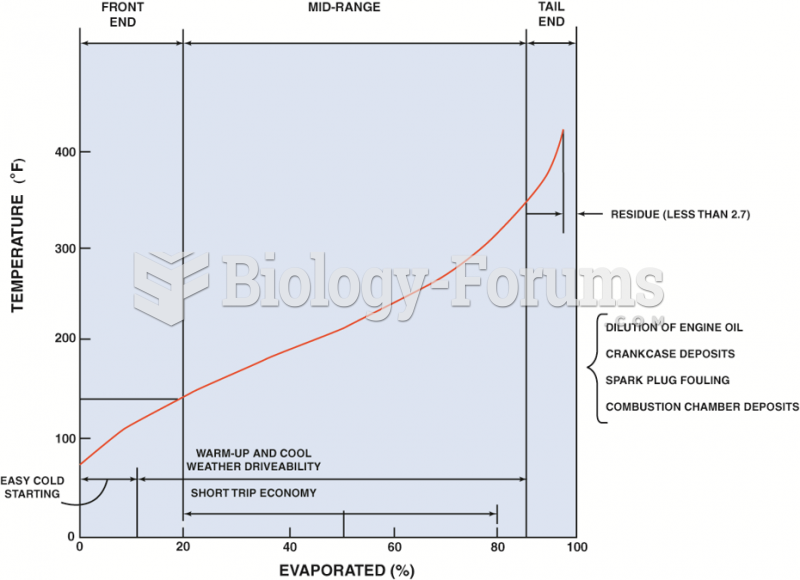 A typical distillation curve. Heavier molecules evaporate at higher temperatures and contain more ...
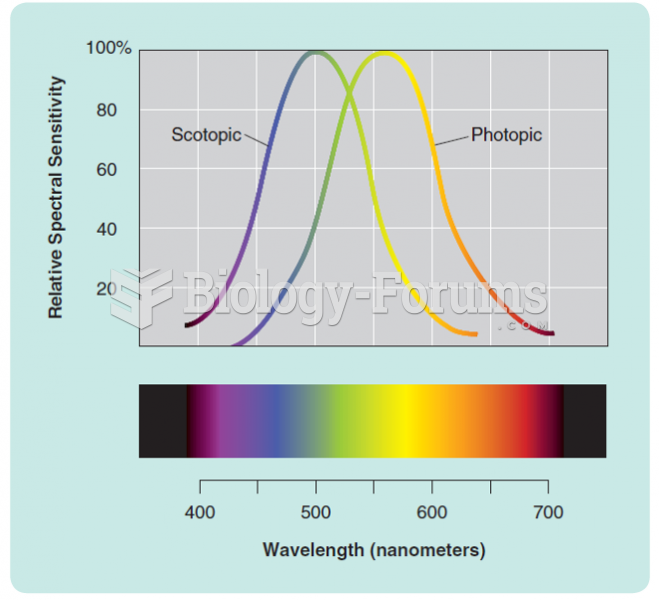 Human photopic (cone) and scotopic (rod) spectral sensitivity curves. The peak of each curve has ...
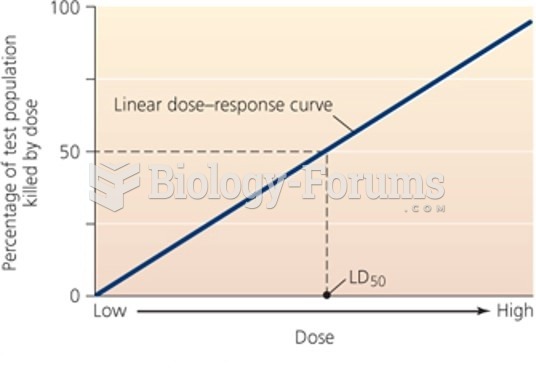 Linear dose-response curve
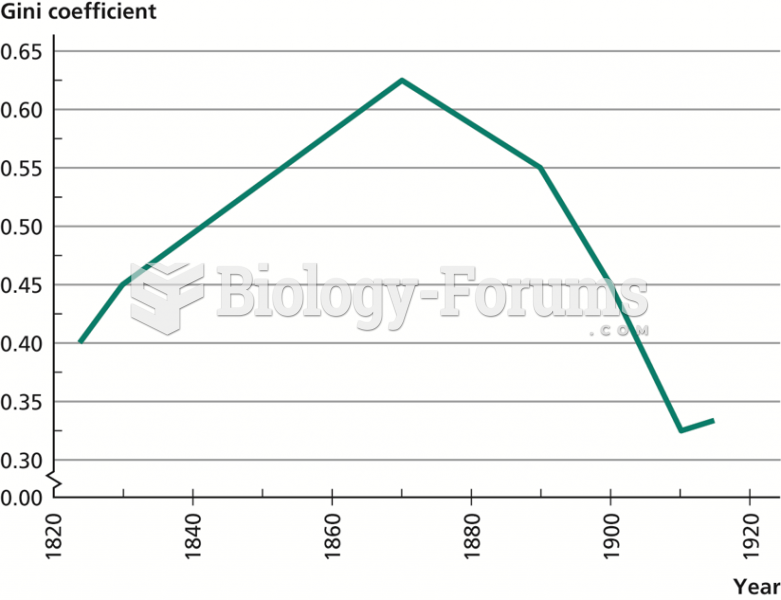 The Kuznets Curve in England and Wales, 1823–1915
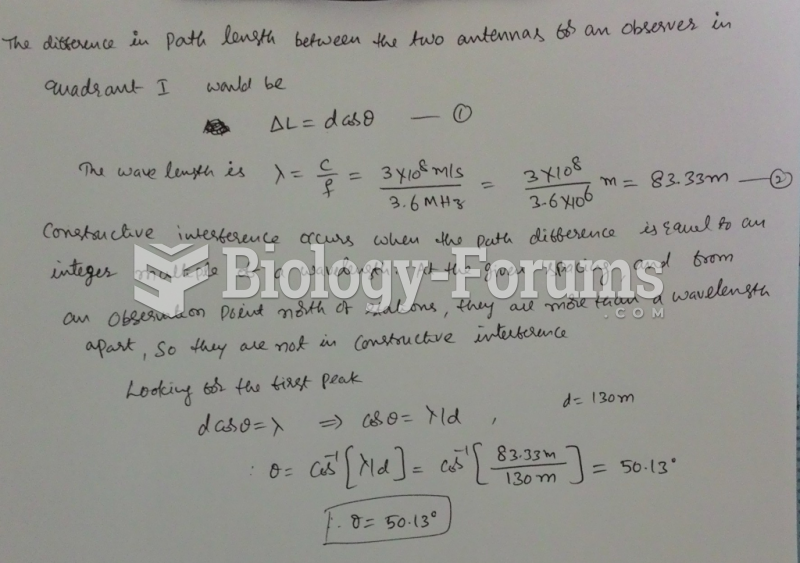 Two radio antennas are 130 m apart on a north-south line. The two antennas radiate in phase at ...
 Electric Light Orchestra (ELO) - Telephone Line + Lyrics