|
|
|

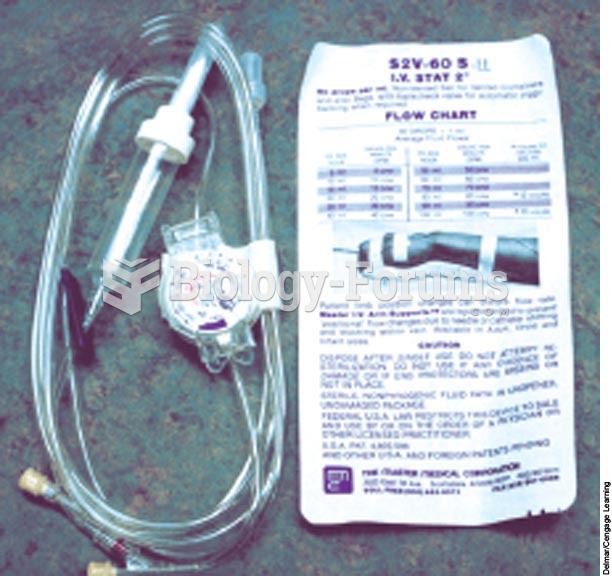 Dial-A-Flo in-line device to regulate IV flow.
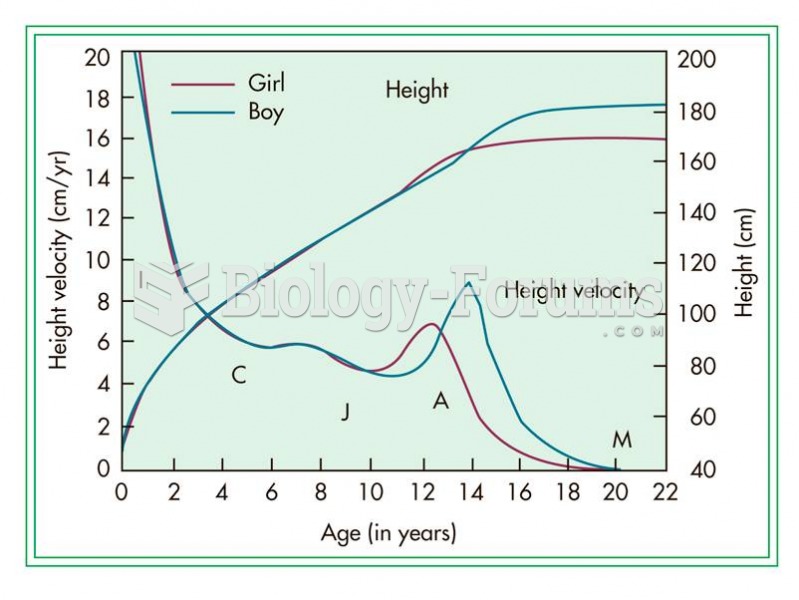 The adolescent growth spurt in humans is seen as a “bump” in the height curve and a “spike” in the h
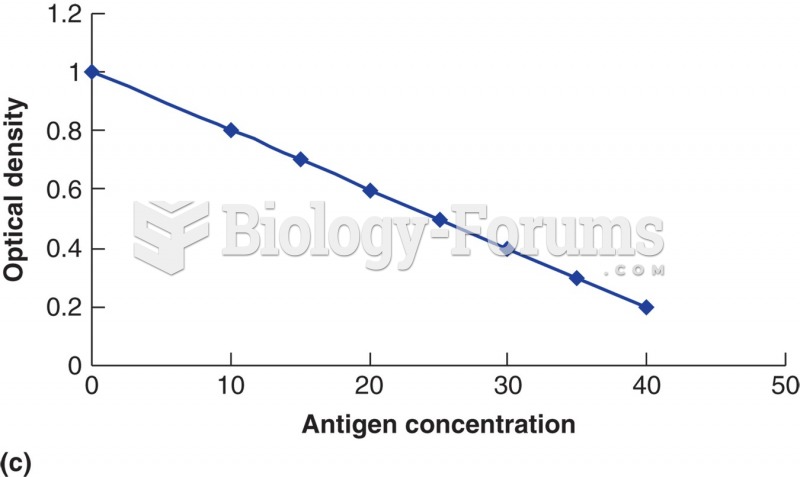 The relationship of substrate con- version (as measured by optical density) to the amount of patient ...
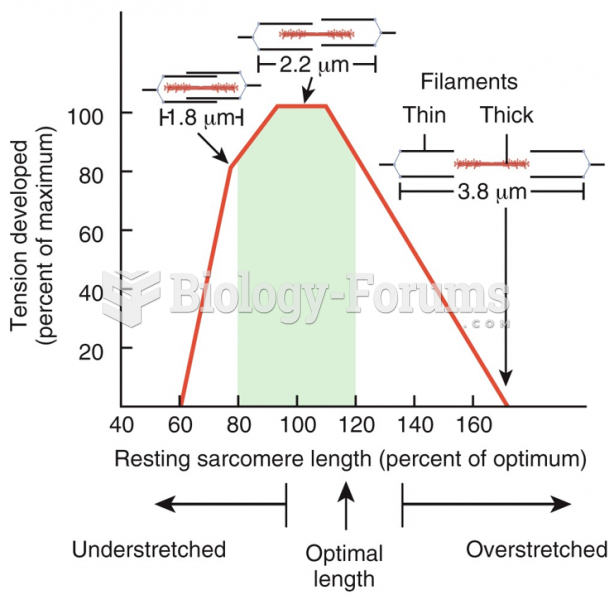 Length-Tension Relationship
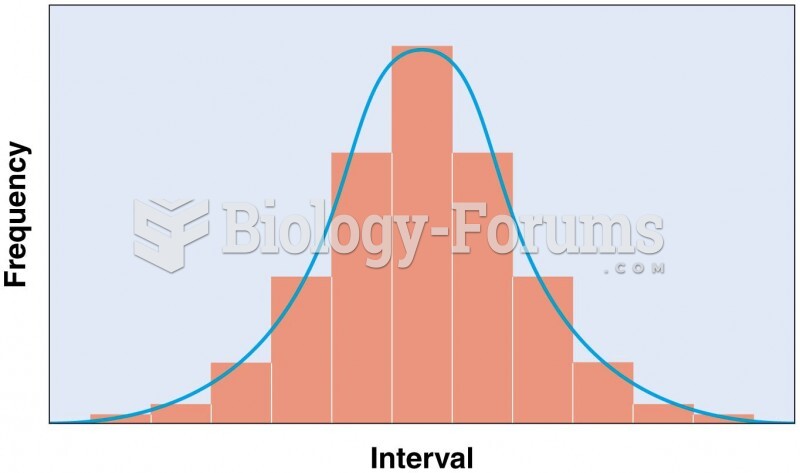 Normal frequency distribution, characterized by a bell-shaped curve
 Generation of the F2 trihybrid phenotypic ratio using the forked-line method