|
|
|

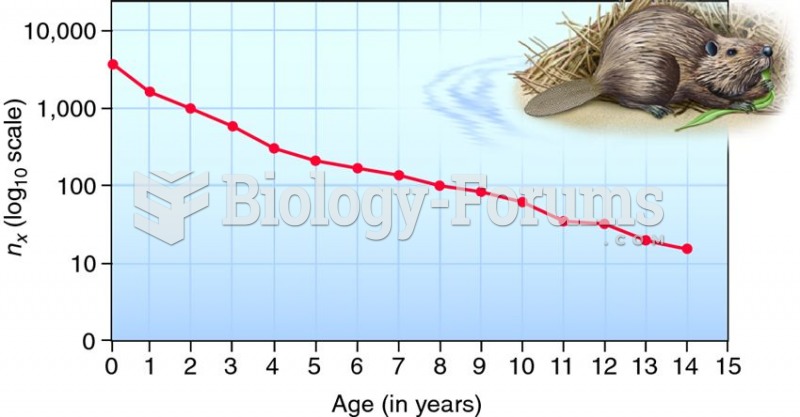 Survivorship curve for the North American beaver.
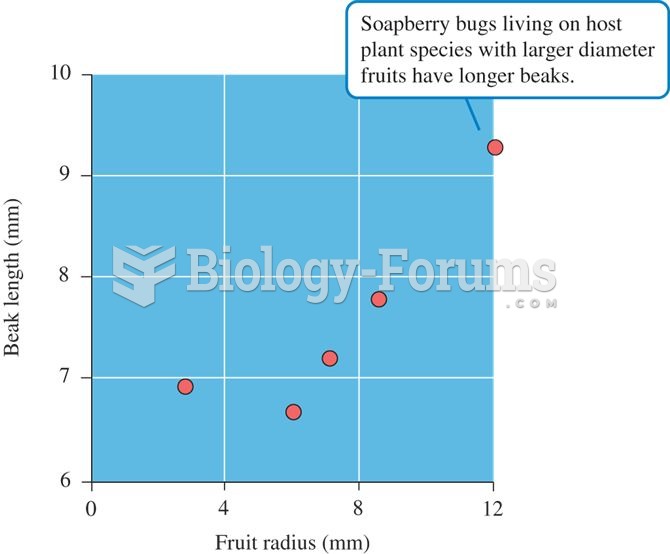 Relationship between fruit radius and beak length in populations of native and introduced species of
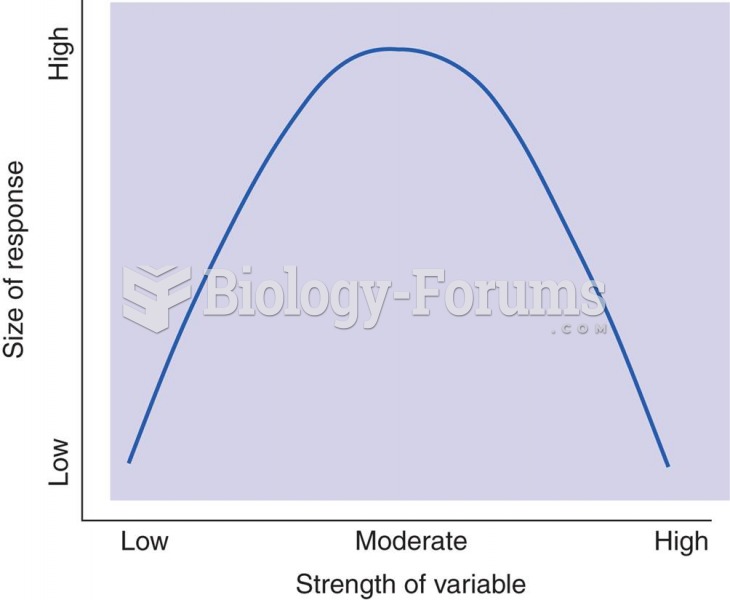 An Inverted U Curve
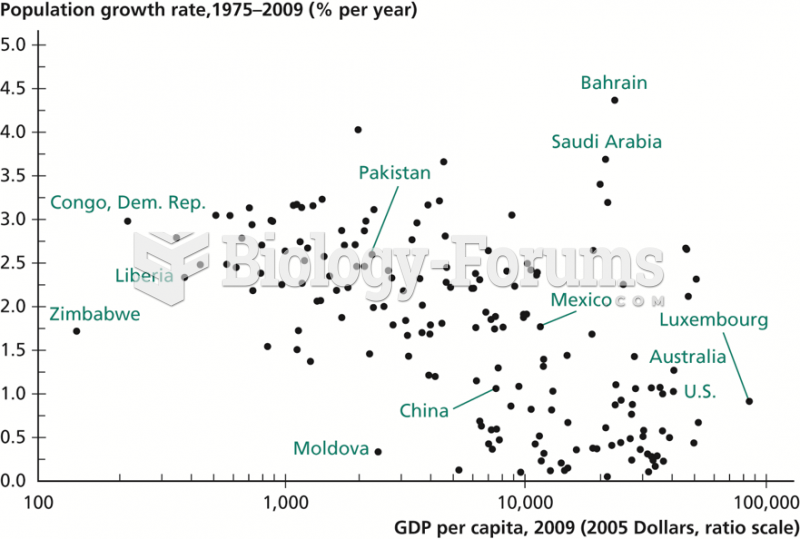 Relationship Between Income per Capita and Population Growth
 The forked-line method for determining gamete genotype frequency
 The circadian rhythm is a wave-like curve