|
|
|

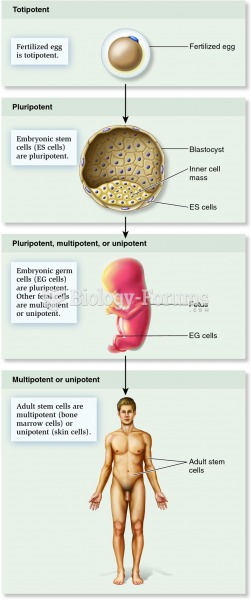 Occurrence of stem cells at different stages of mammalian development
 Stem cells, undecided
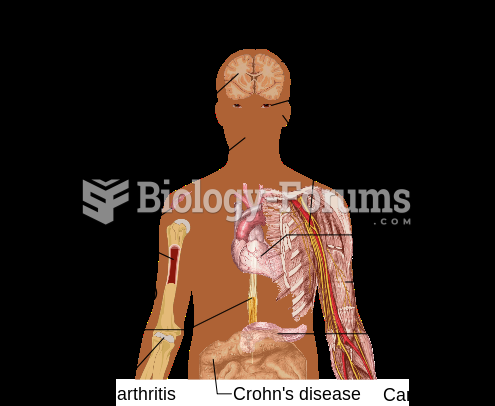 Potential uses of stem cells
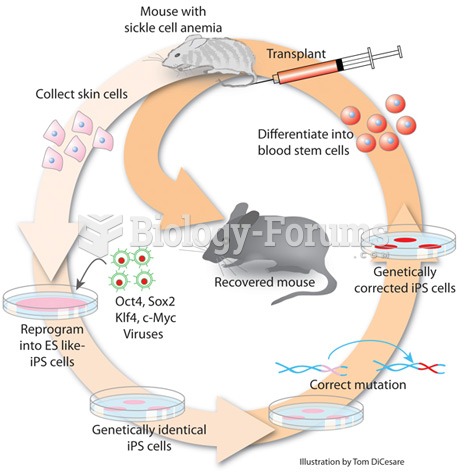 induced pluripotent stem cells
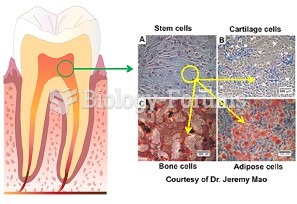 Dental Pulp Stem Cells
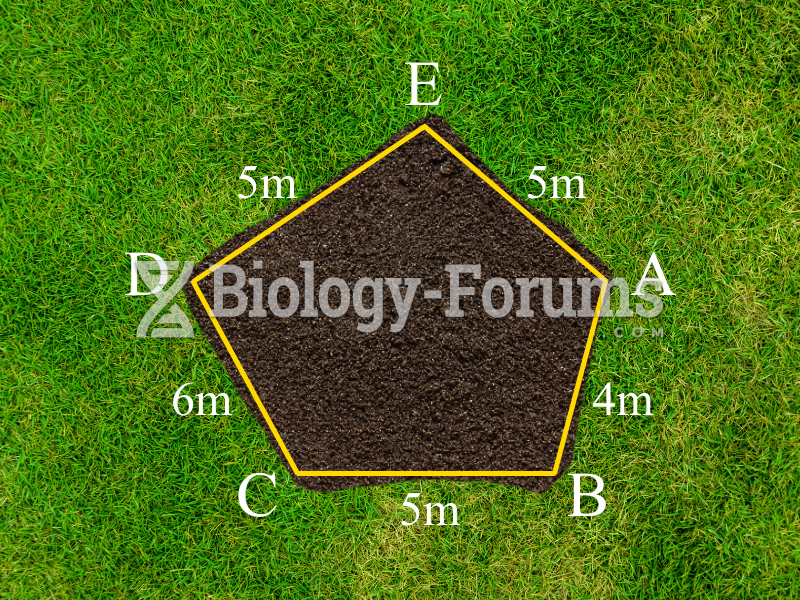 Plot of land (Part b)
|
|
|
Occurrence of stem cells at different stages of mammalian development
Stem cells, undecided
Potential uses of stem cells
induced pluripotent stem cells
Dental Pulp Stem Cells
Plot of land (Part b)
For a complete list of videos, visit our video library