|
|
|

 Juglans nigra (Black Walnut tree) lower leaf surface
 Blood Stem cell classification
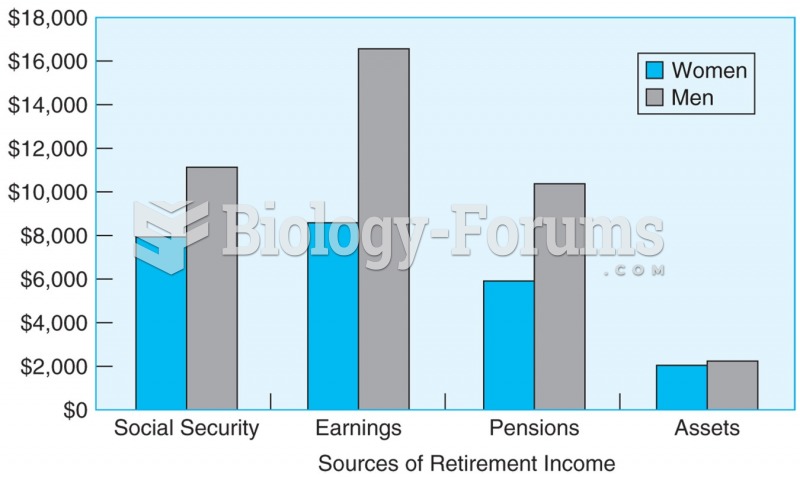 Women who are 65 and older have a lower median income from all sources than men in the same age ...
 How to plot a cosine function containing an amplitude and phase-shift (Question 2 of 2)
 A 16-input multiplexer is to be used to perform parallel-to-serial data conversion. Which of ...
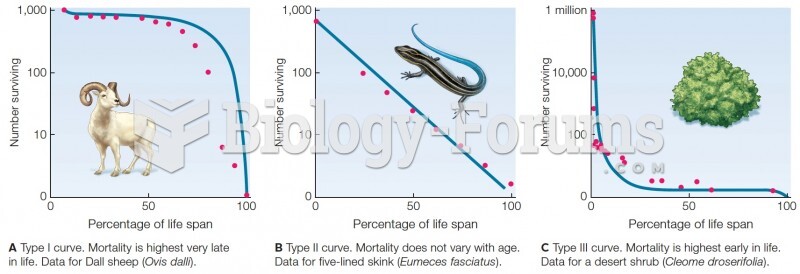 Survivorship curves. Blue lines are theoretical curves. Red dots are data from field studies.