|
|
|

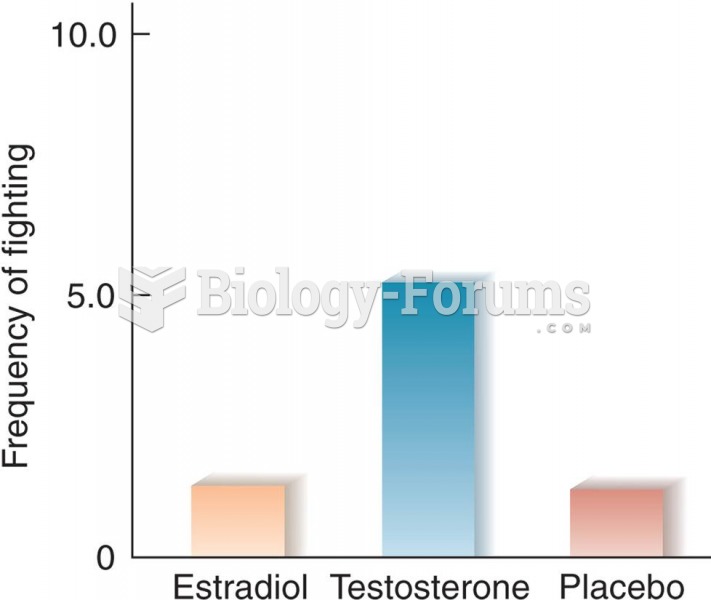 Effects of Estradiol and Testosterone on Interfemale Aggression in Rats (Based on data from van de P
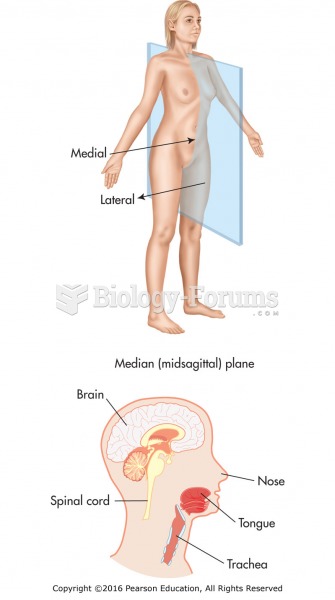 Midsagittal or median plane along with a sagittal view of the head.
 How to fit an exponential model to data
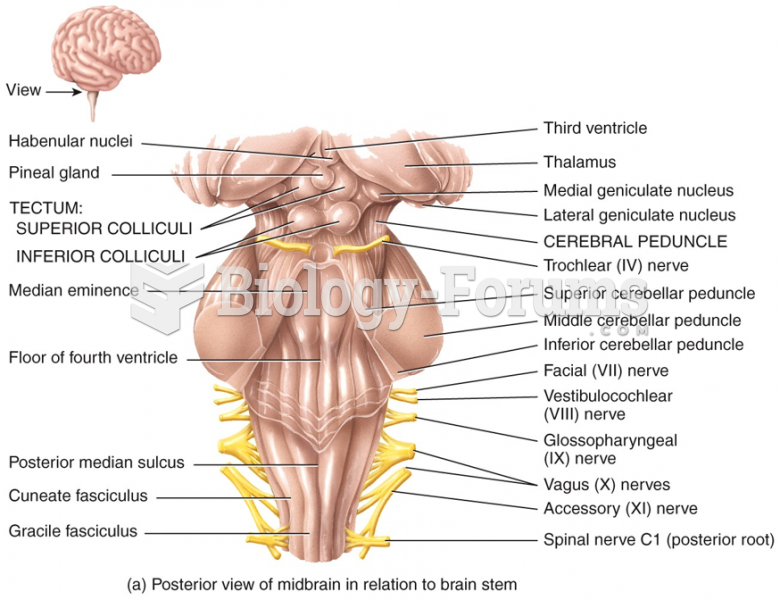 Posterior view of midbrain in relation to brain stem
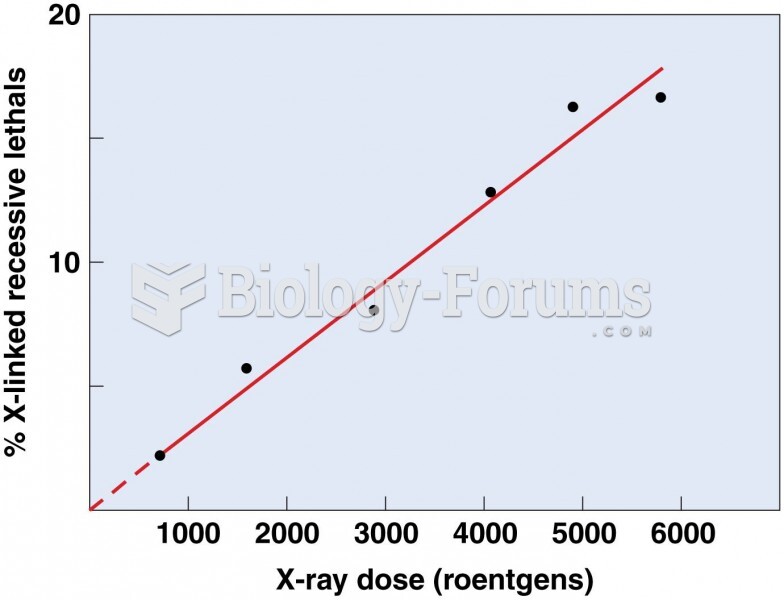 Plot of the percentage of X-linked recessive mutations