|
|
|

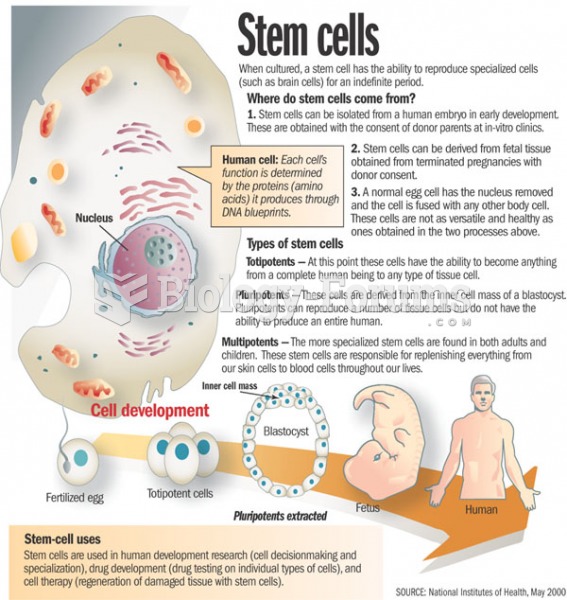 Stem cells
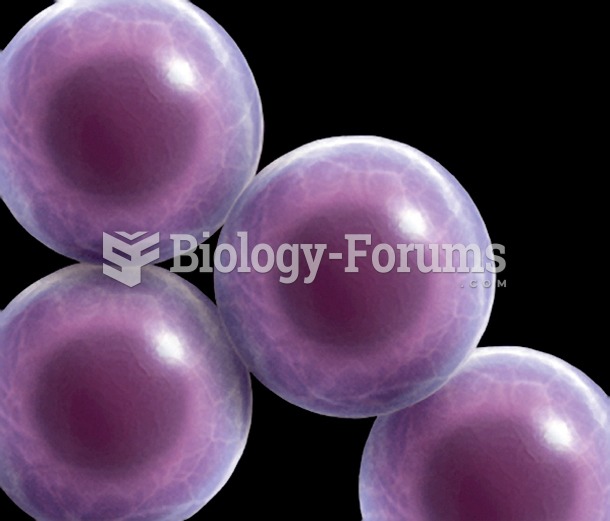 Stem Cells
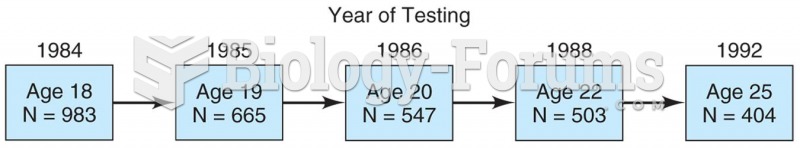 Model of a longitudinal study in which 983 students were surveyed in 1984 and then again in 1985, 19
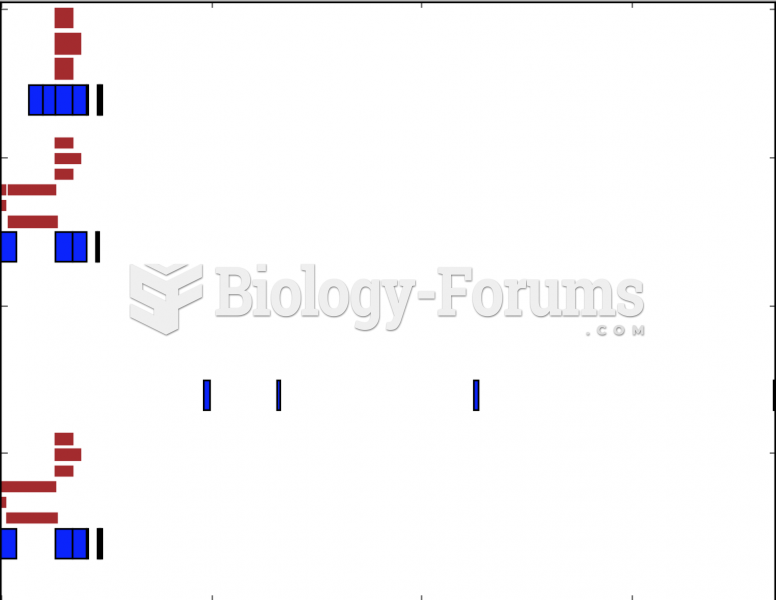 Exon-Protein Plot
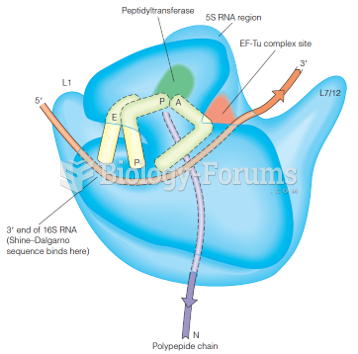 A model of the 70S ribosome based upon early structural data
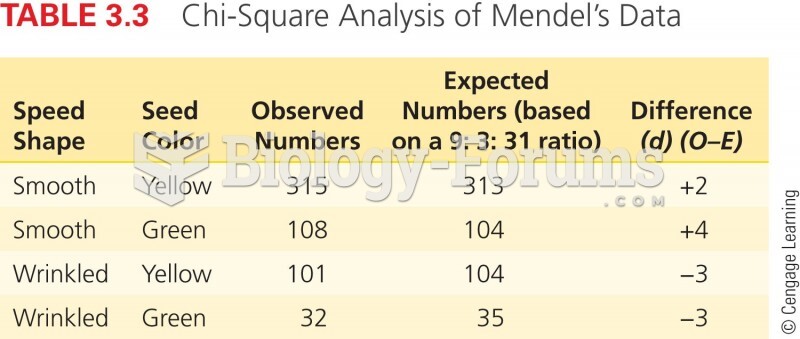 Chi-Square Analysis of Mendel's Data