A histogram is an effective tool for graphically describing a joint frequency distribution.
Indicate whether the statement is true or false
Question 2
The following samples are observations taken from the same elements at two different times:
Unit Sample 1 Sample 2
1 15.1 4.8
2 12.3 5.7
3 14.9 6.2
4 17.5 9.4
5 18.1 2.3
6 18.4 4.7
Assume that the populations are normally distributed and construct a 90 confidence interval for the difference in the means of the distribution at the times in which the samples were taken.
A) (7.6232, 13.4434)
B) (5.2825, 15.8127)
C) (6.8212, 14.7821)
D) (7.4122, 14.6801)

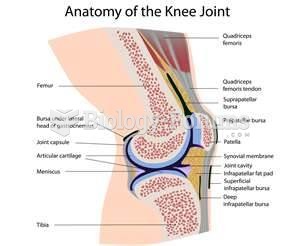 knee joint
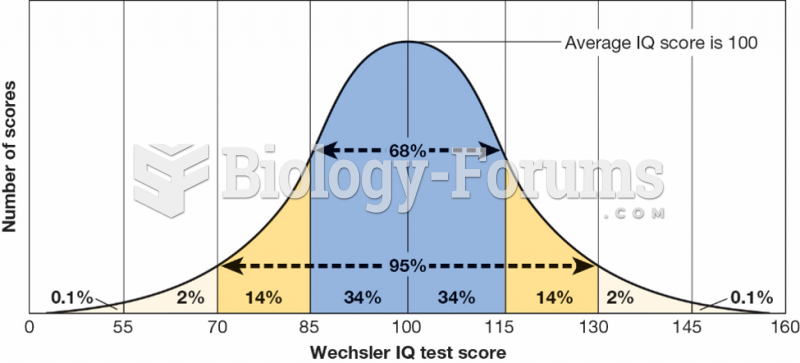 Normal Distribution of IQ Scores
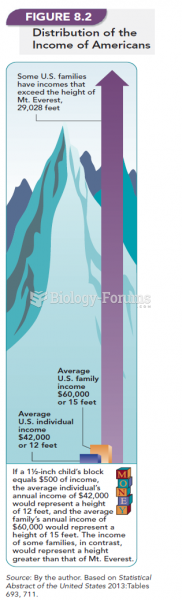 Distribution of the Income of Americans
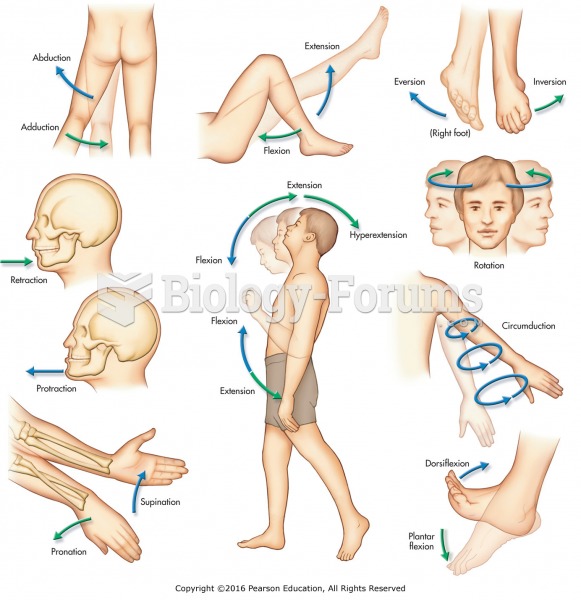 Classification of joint movements.
 Distribution of Thunderstorms: Detailed data on cloud-to-ground lightning flashes have been ...
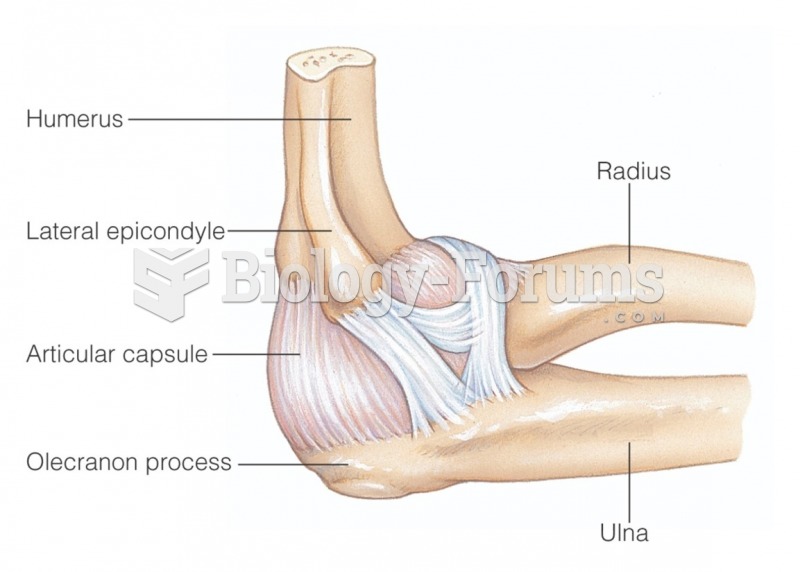 Elbow joint