A histogram is an effective tool for graphically describing a joint frequency distribution.
Indicate whether the statement is true or false
Question 2
The following samples are observations taken from the same elements at two different times:
Unit Sample 1 Sample 2
1 15.1 4.8
2 12.3 5.7
3 14.9 6.2
4 17.5 9.4
5 18.1 2.3
6 18.4 4.7
Assume that the populations are normally distributed and construct a 90 confidence interval for the difference in the means of the distribution at the times in which the samples were taken.
A) (7.6232, 13.4434)
B) (5.2825, 15.8127)
C) (6.8212, 14.7821)
D) (7.4122, 14.6801)

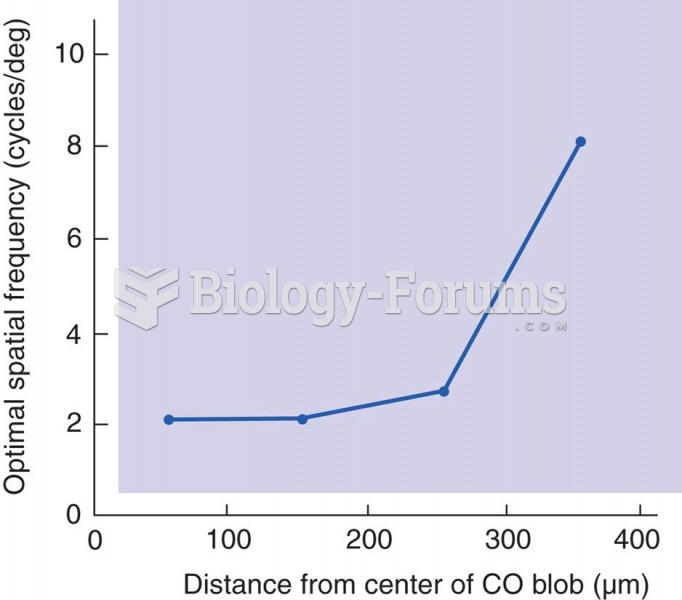 Organization of Spatial Frequency
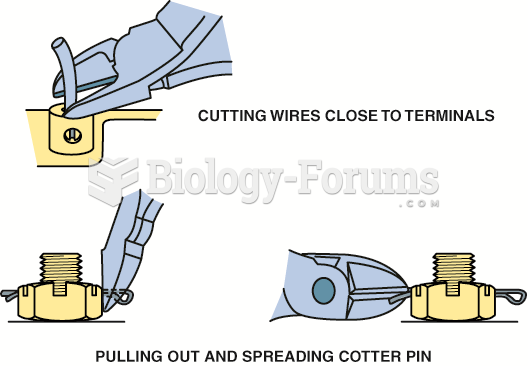 Diagonal pliers are another common tool that has many names.
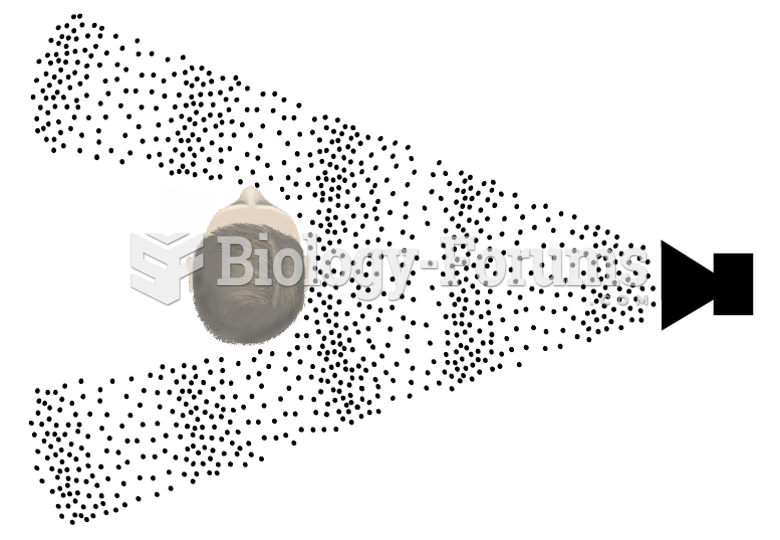 Localizing the Source of High-Frequency Sounds
 Human Relations: The Art and Science of Building Effective Relationships
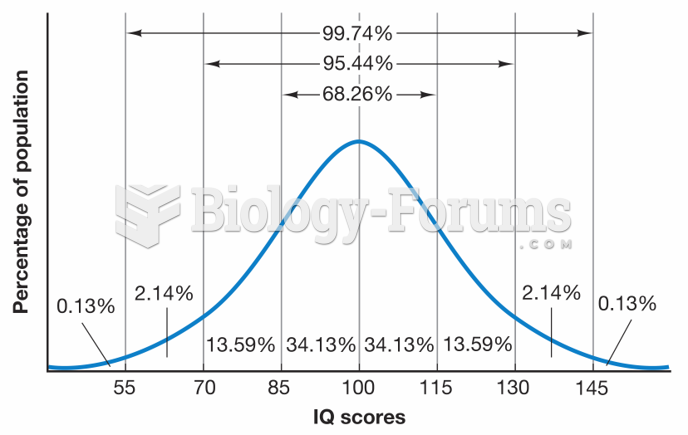 Expected Distribution of IQ Scores
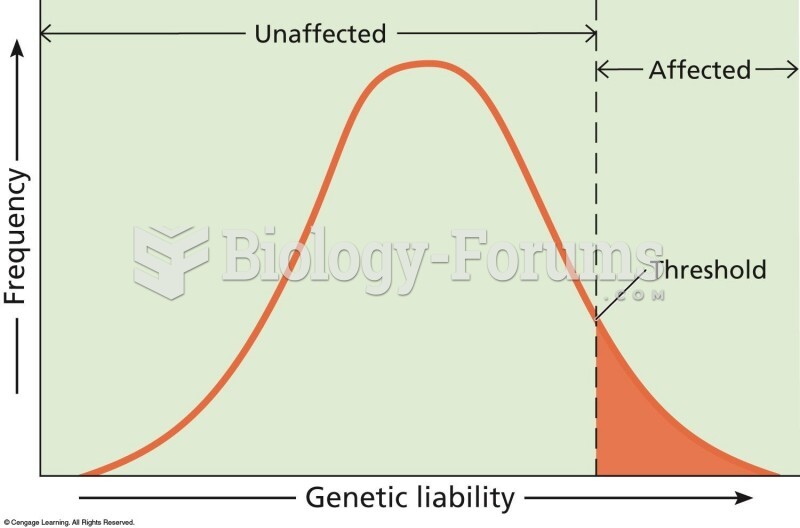 The threshold model explains the discontinuous distribution of some multifactorial traits. In this m