This topic contains a solution. Click here to go to the answer
|
|
|

 Summary of US Census Data
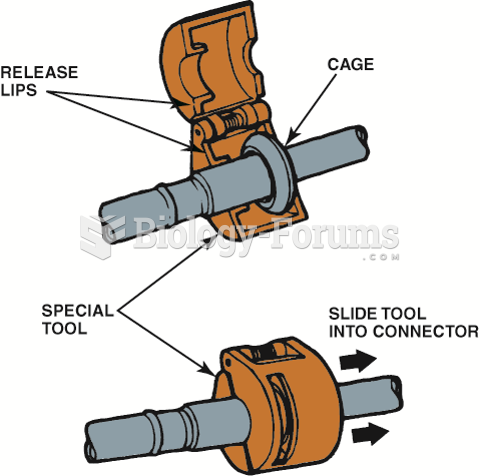 Ford spring-lock connectors require a special tool for disassembly.
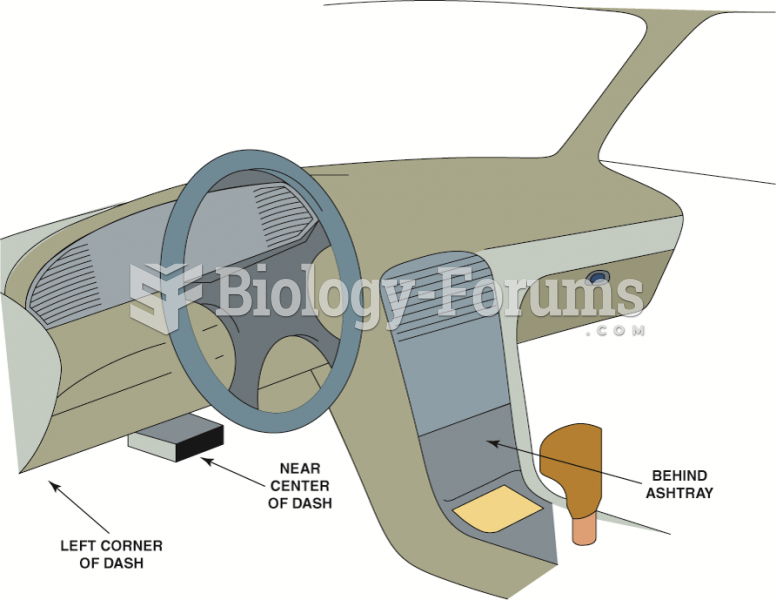 The data link connector (DLC) can be located in various locations.
 Display Rules
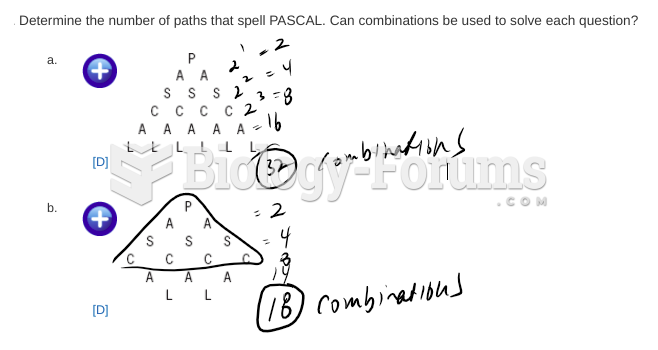 Data management questions
 A hypothetical grid of data used in synteny testing