|
|
|

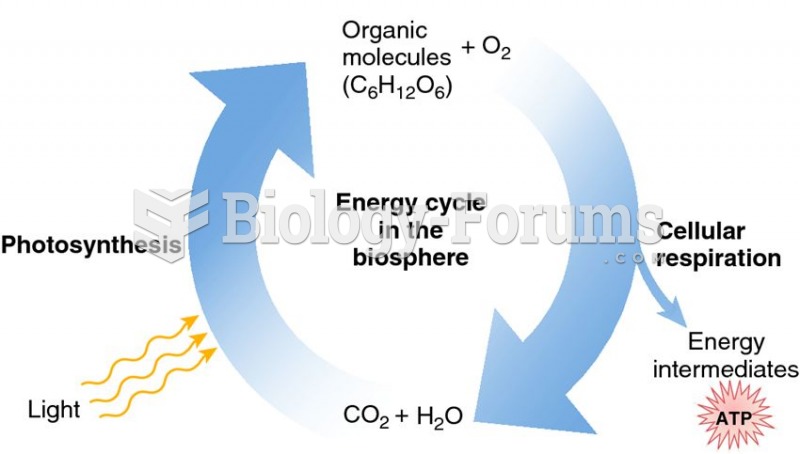 Energy cycle of the biosphere
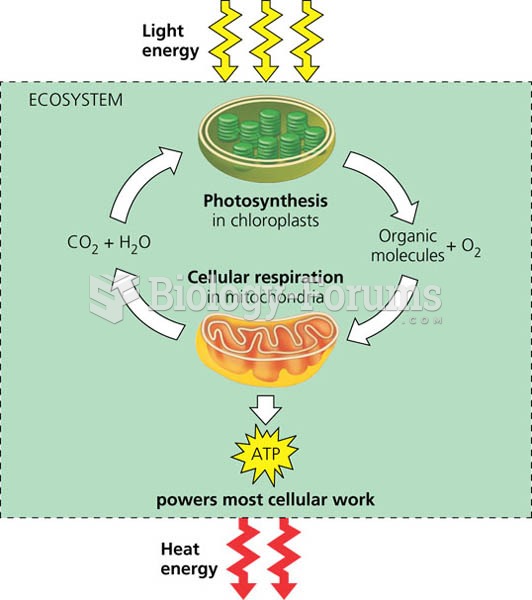 Energy flow and chemical recycling in ecosystems.
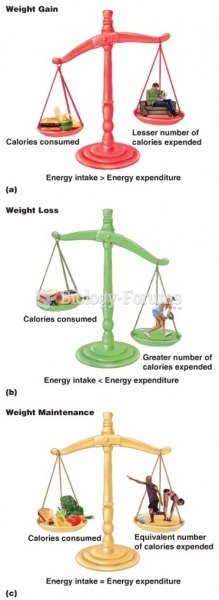 Energy Balance
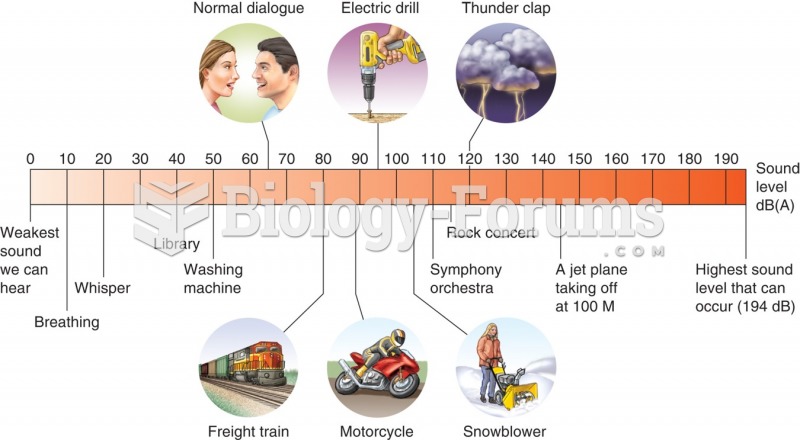 This illustration shows the decibel level in various locations and associated with different ...
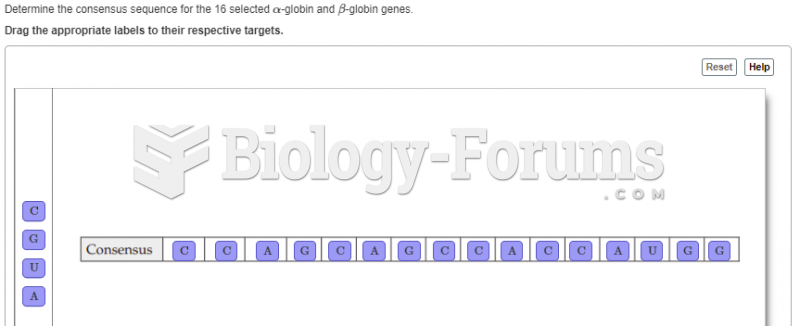 8.The following table contains DNA-sequence information compiled by Marilyn Kozak (1987). The ...
 Table
Table