|
|
|

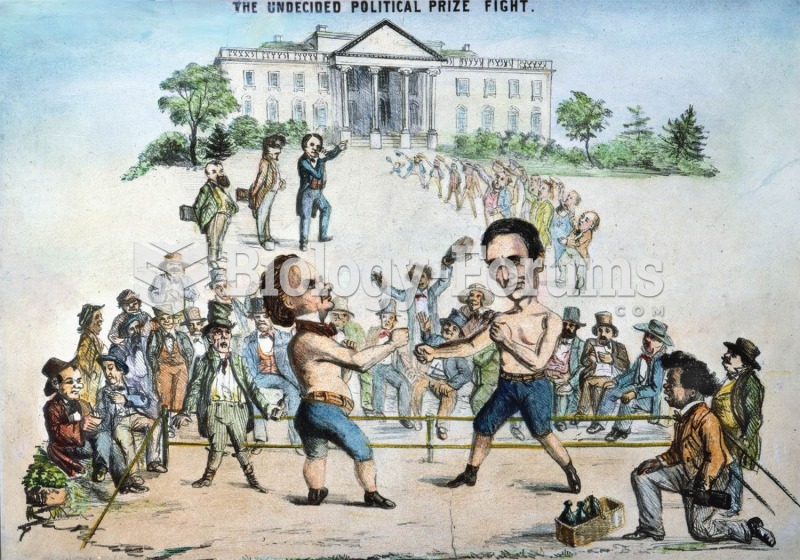 That politics was always a rough business is shown in this cartoon, which shows Lincoln, assisted by
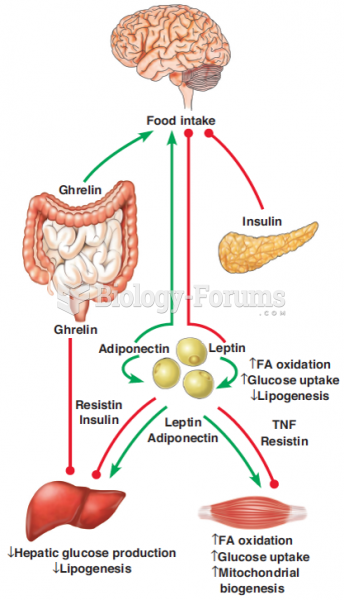 Endocrine regulation of food intake and energy homeostasis in mammals
 Geothermal energy and powers Earth’s systems
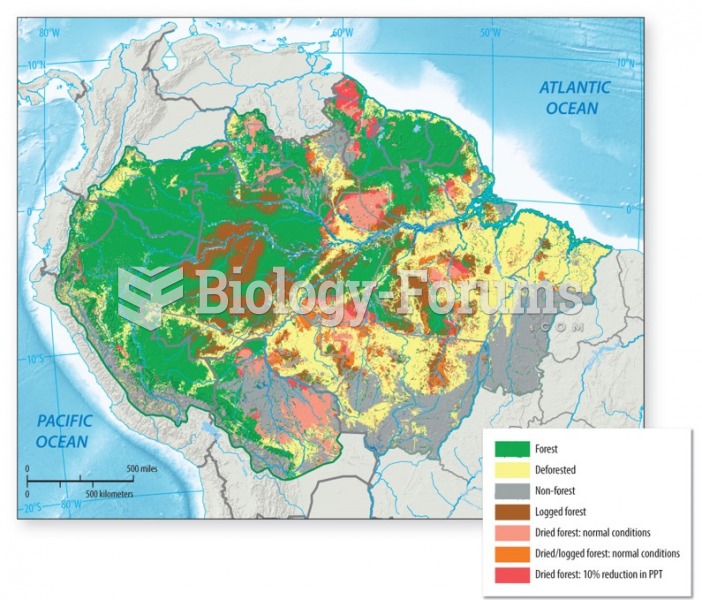 Deforestation is one of the main sources of greenhouse gas emissions
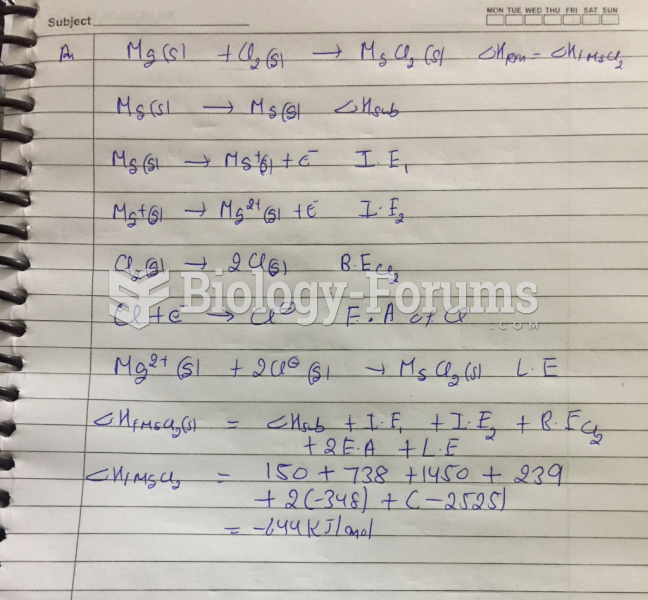 Use the information in the above table to establish a Born-Haber cycle to determine the ...
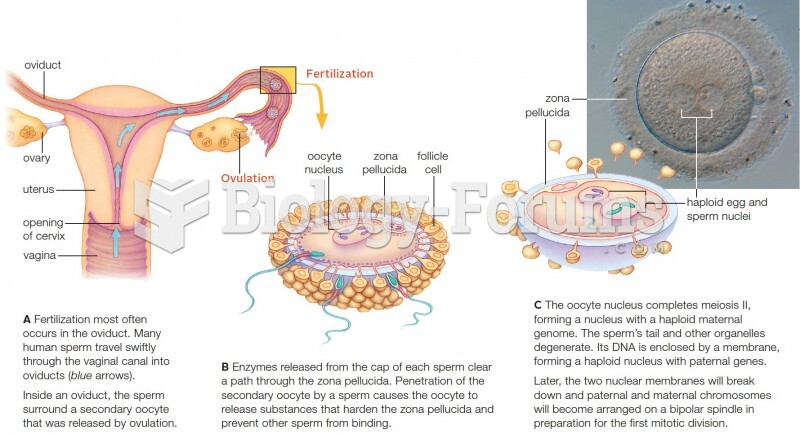 Events in human fertilization. The light micrograph shows a fertilized human oocyte.