|
|
|

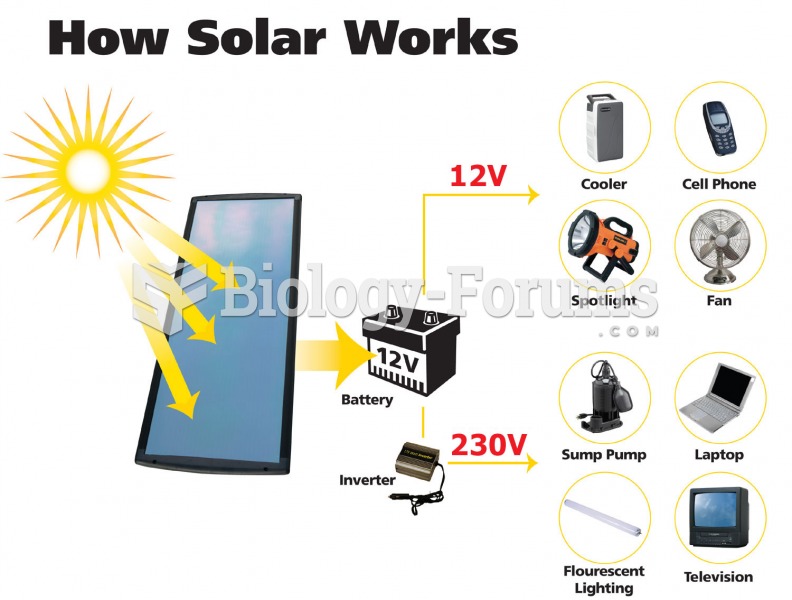 How solar-energy power works
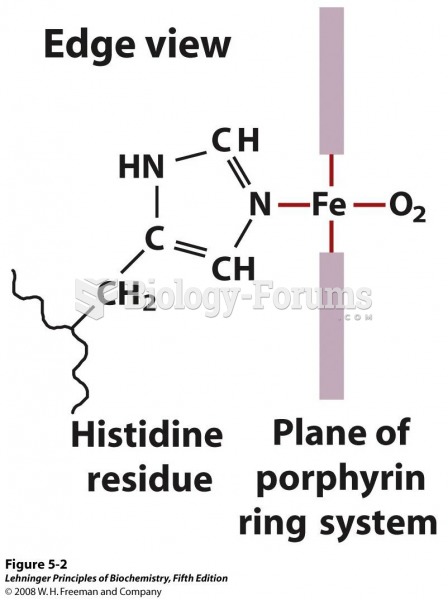 The heme group viewed from the side. This view shows the two coordination bonds to Fe2+
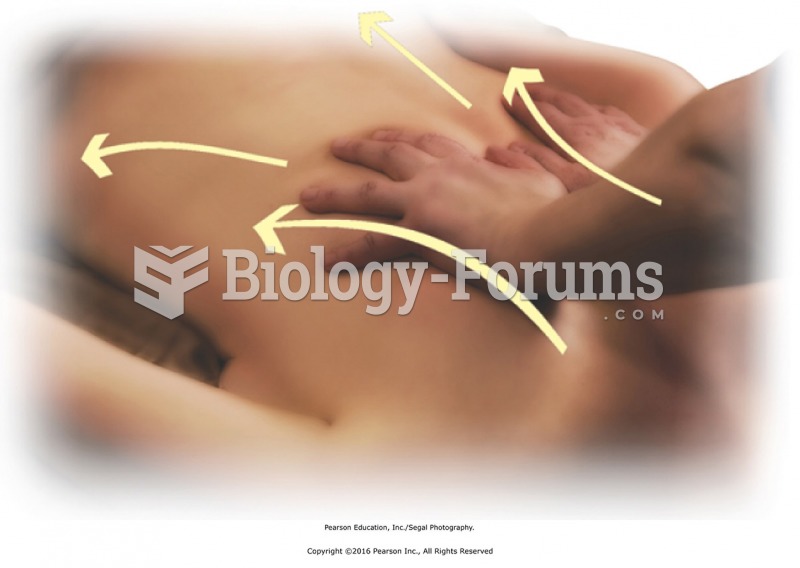 Finish with bilateral stroking to the entire back. Stand at head of the table with fingers pointing ...
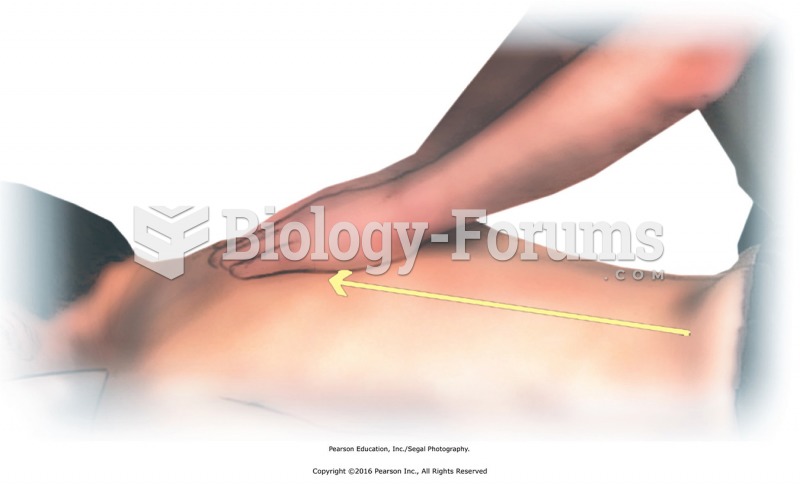 Effleurage to the entire back to apply oil. Stand at the side of the table near the recipient’s ...
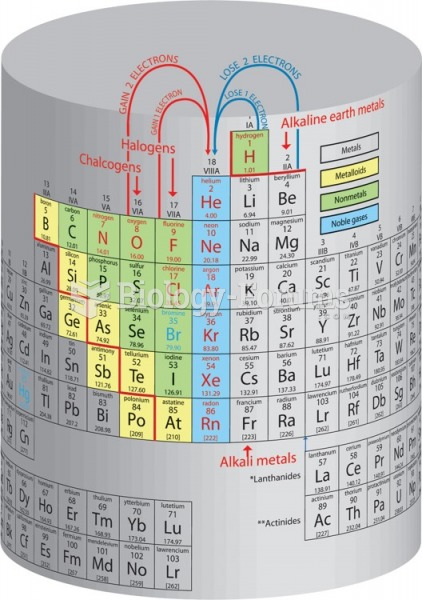 The periodic cylinder of the elements. When the periodic table is folded in such a way that the ...
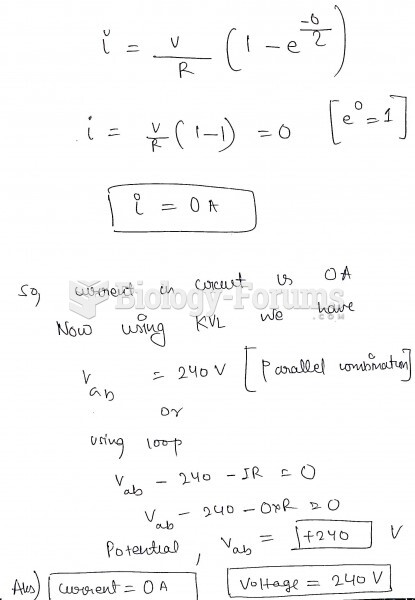 The figure shows an LR circuit with a switch and a 240-volt battery. At the instant the switch ...