|
|
|

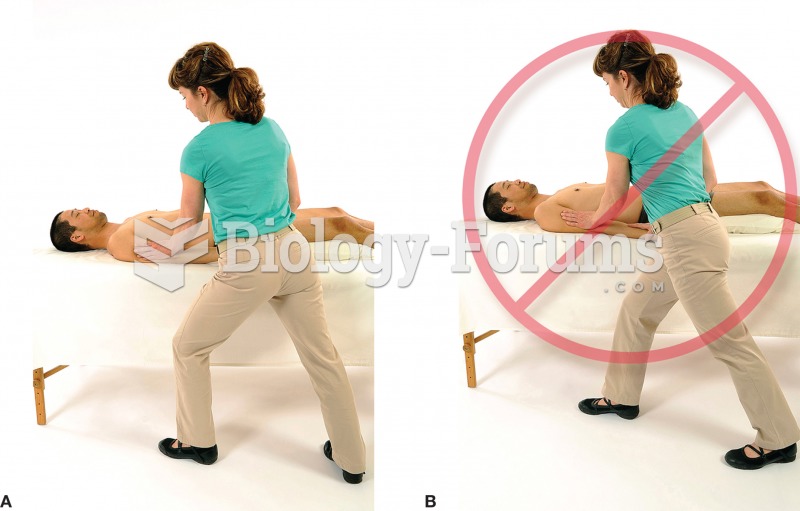 a) Lunge with your legs open to the table. b) Avoid lunging with your legs close to table.
 Sources of hepatitis C infection.
 Finish with bilateral stroking to the entire back. Stand at head of the table with fingers pointing ...
 “New” Renewable Energy Sources
 Investment in Computers as a Percentage of GDP, 1982–2009
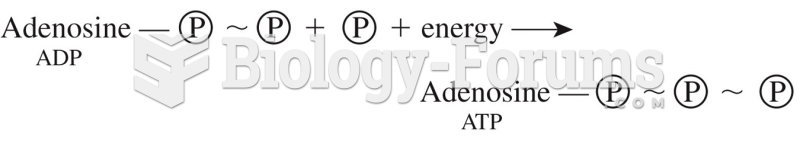 Energy Transfer