This topic contains a solution. Click here to go to the answer
|
|
|

 Typical DSO survey in Celestia
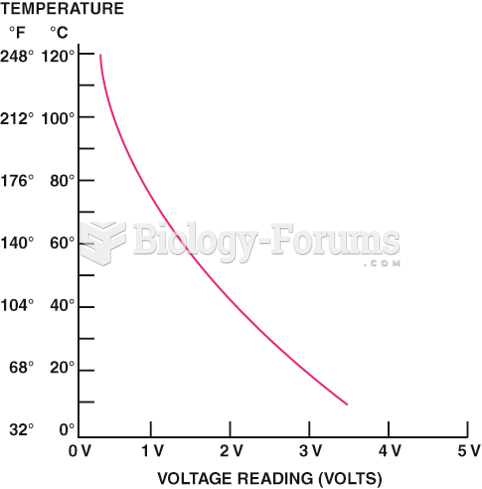 A typical ECT sensor temperature versus voltage curve.
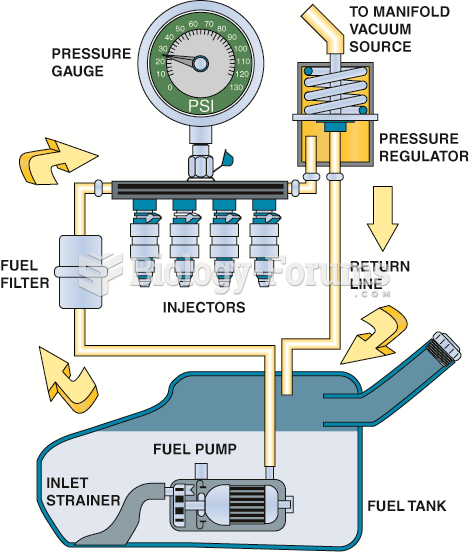 A typical port fuel-injected system showing a vacuum-controlled fuel-pressure regulator.
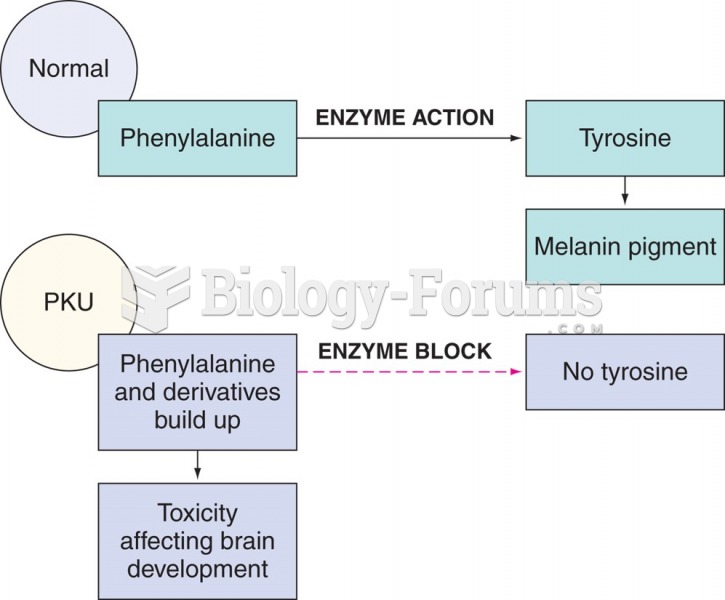 Enzyme block in phenylketonuria (PKU).
 An agglutination inhibition reaction. Commercial kit materials would create an agglutination ...
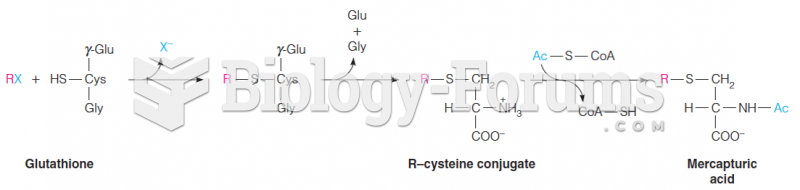 Glutathione reaction with compound (denoted RX)