This topic contains a solution. Click here to go to the answer
|
|
|

 A typical 12 volt test light.
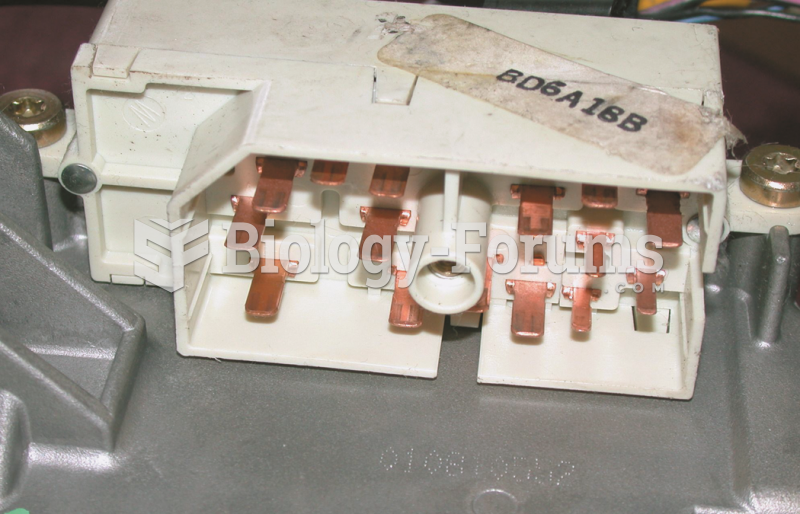 A typical ignition switch showing all of the electrical terminals after the connector has been ...
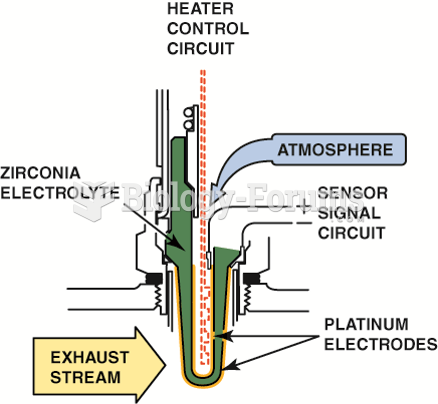 A typical heated zirconia oxygen sensor, showing the sensor signal circuit that uses the outer ...
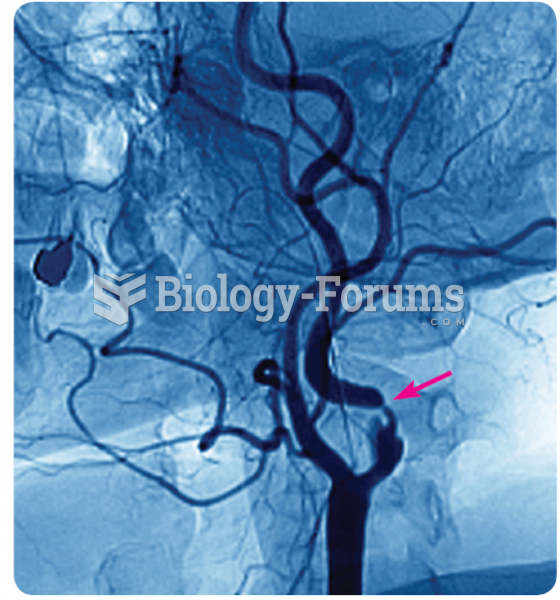 An angiogram that illustrates narrowing of the carotid artery (see arrow), the main pathway of blood ...
 Typical Sandwich Bar
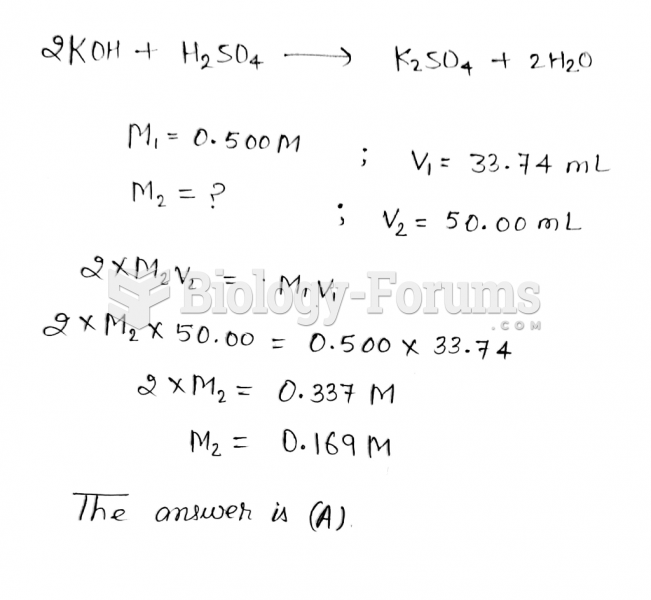 In an acid-base neutralization reaction, 33.74 mL of 0.500 M potassium hydroxide reacts with ...