This topic contains a solution. Click here to go to the answer
|
|
|

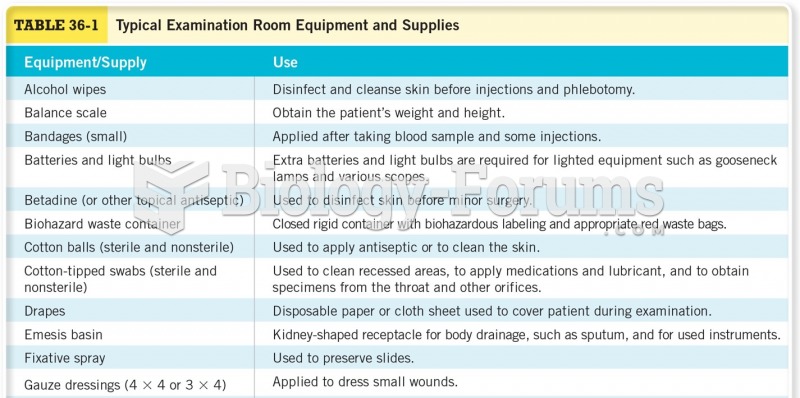 Typical Examination Room Equipment and Supplies
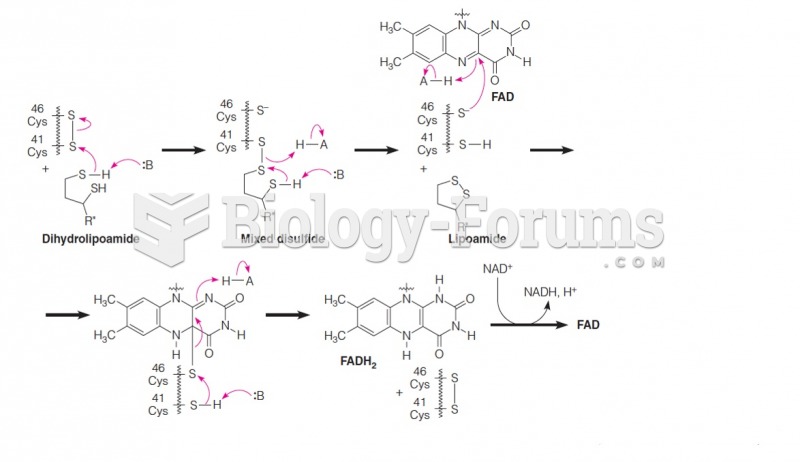 Mechanism of the reoxidation of dihydrolipoamide catalyzed by dihydrolipoamide dehydrogenase
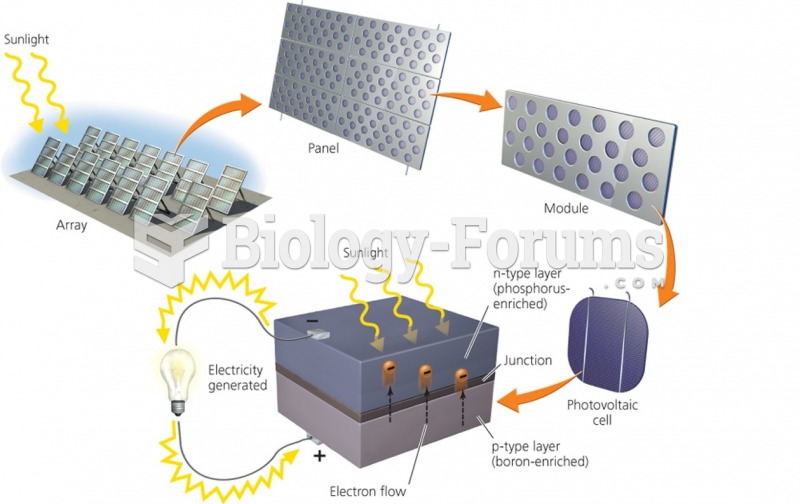 Typical photovoltaic cell
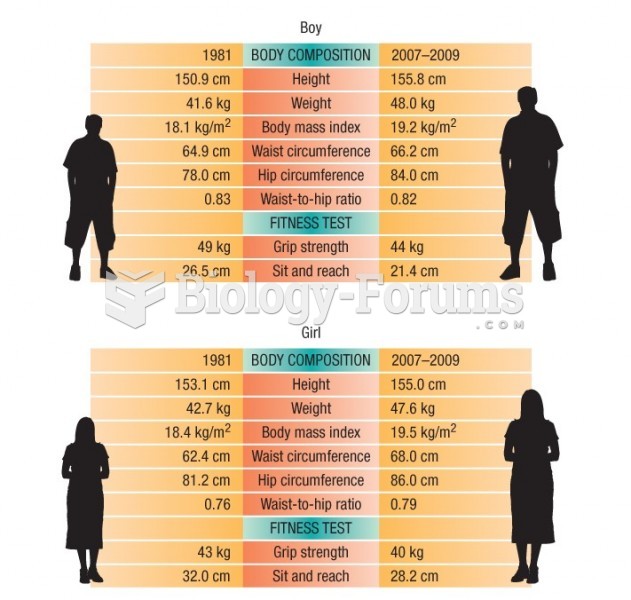 Portrait of Typical 12-year-old Boy and Girl, 1981 and 2007-2009
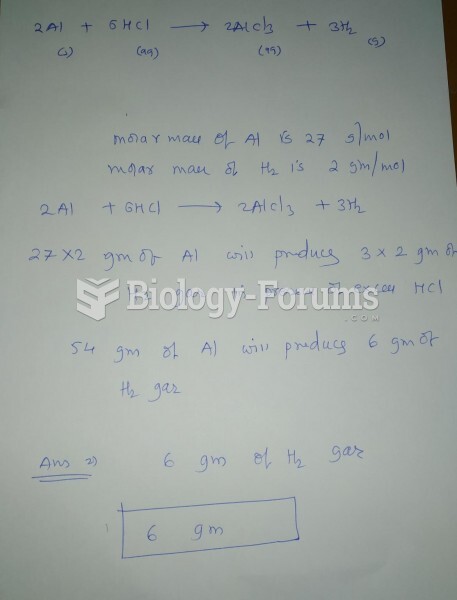 How many grams of H2 gas can be produced by the reaction of 54.0 grams of Al(s) with an excess ...
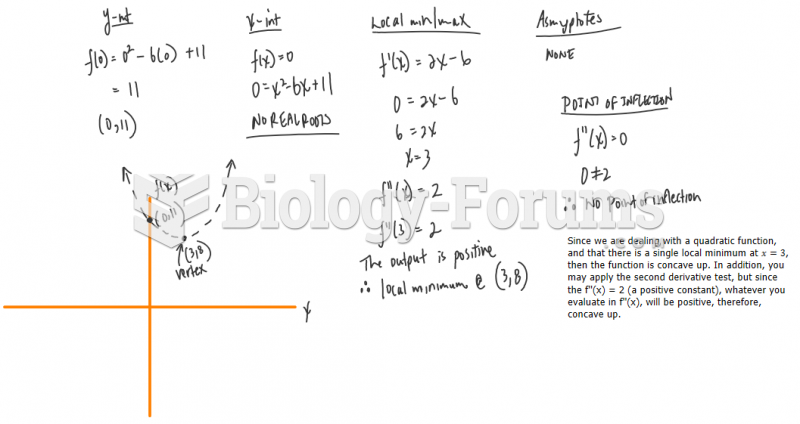 Sketch the graph of the following functions using local maximum/minimums, interc