This topic contains a solution. Click here to go to the answer
|
|
|

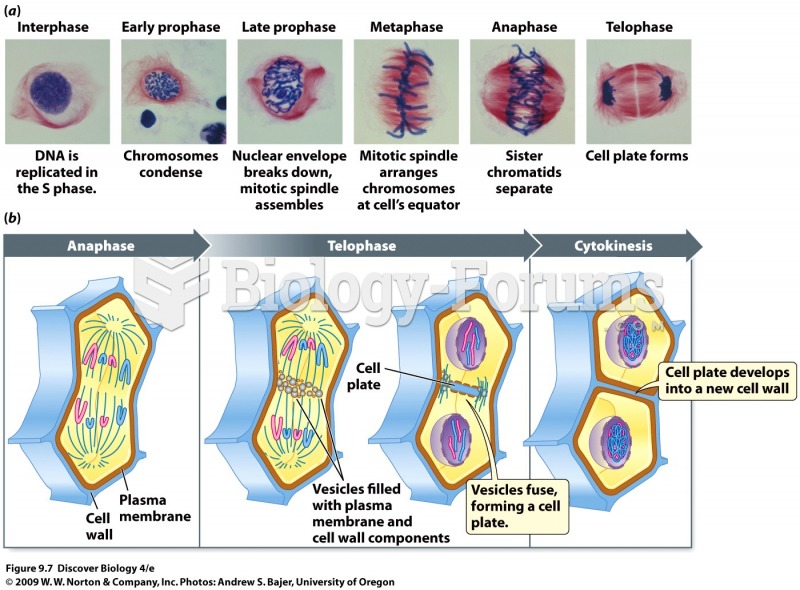 Mitosis five phases
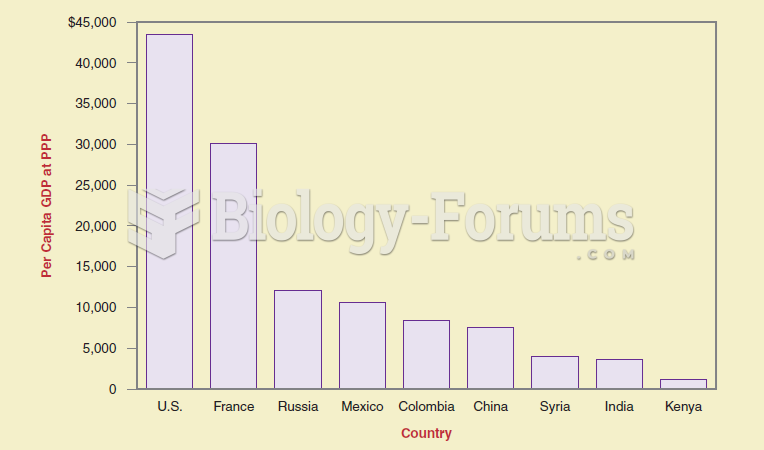 If you want to show differences between items at the same time, a bar graph is more effective than a
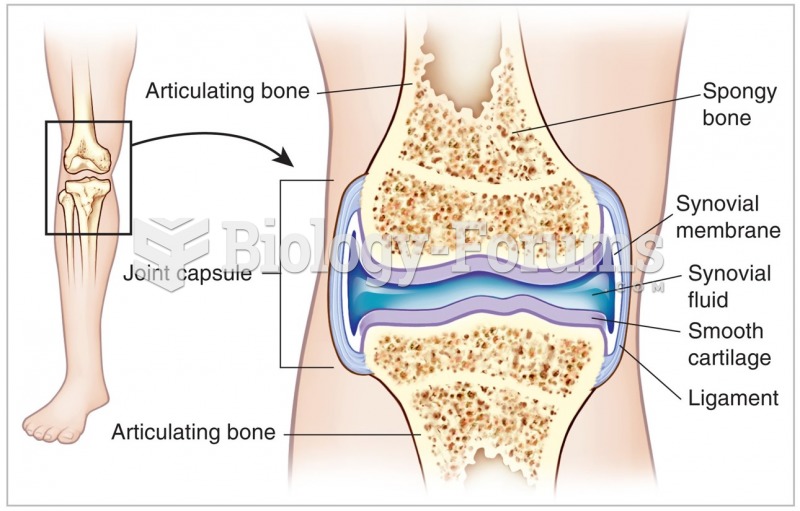 A typical joint.
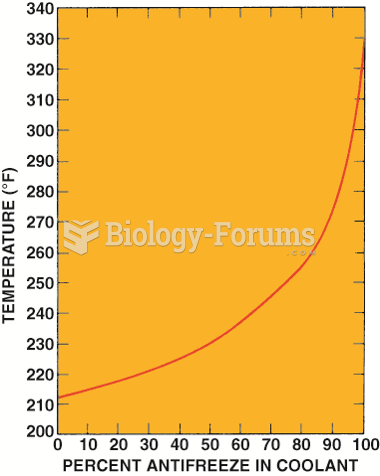 Graph showing how the boiling point of the coolant increases as the percentage of antifreeze in ...
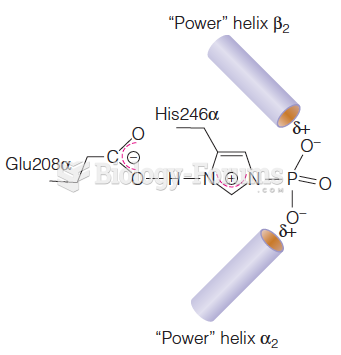 Dipole interaction of E. coli enzyme structure
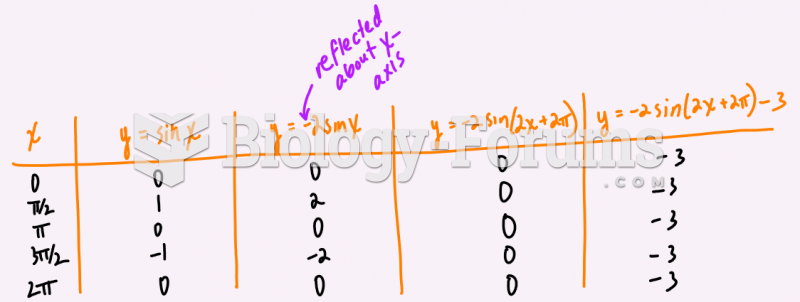 State the transformations on the function f(x)= 4sin(x-pi)-2 and then graph two cycles below.