|
|
|

 The deer mouse and the African elephant represent extremes among mammals of r versus K selection.
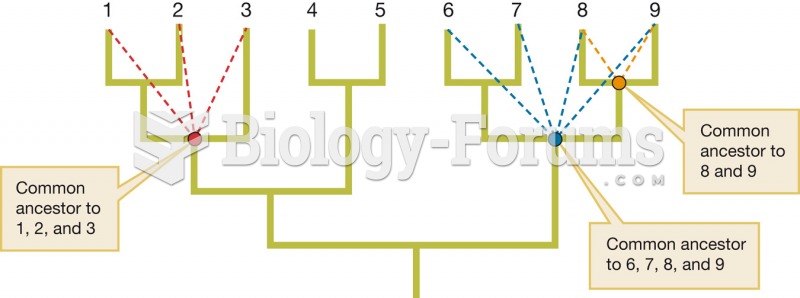 Interior nodes represent common ancestors
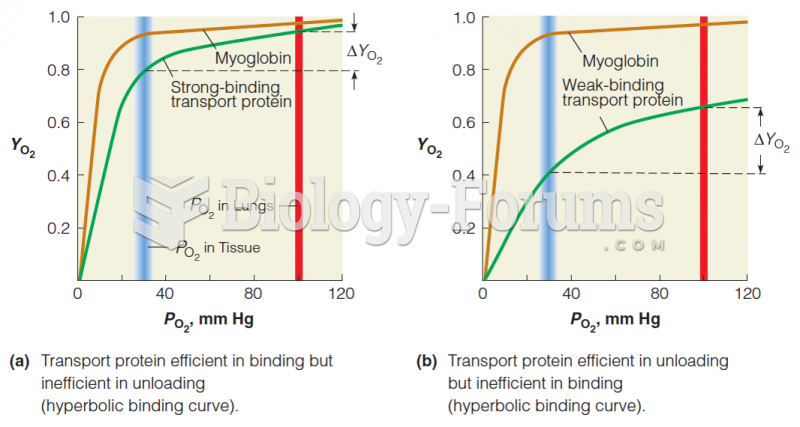 Cooperative vs. noncooperative O2-binding curves
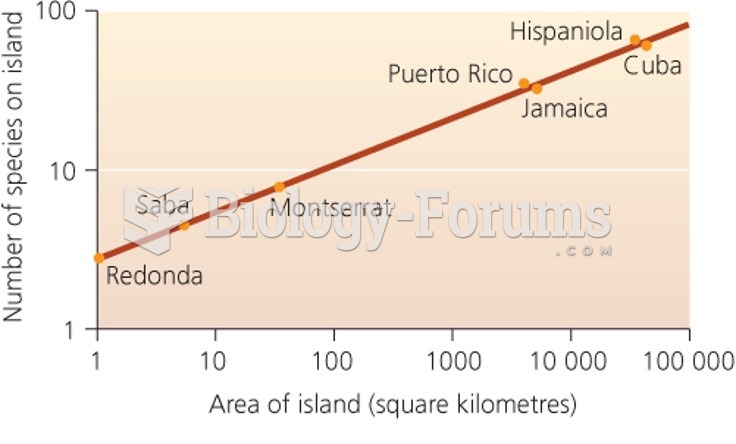 Species-area curves
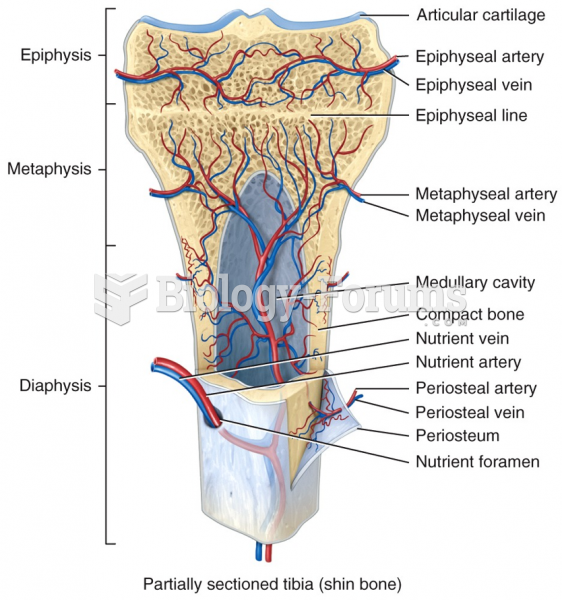 Blood and Nerve Supply of Bone
 Blood Supply to the Lungs