|
|
|

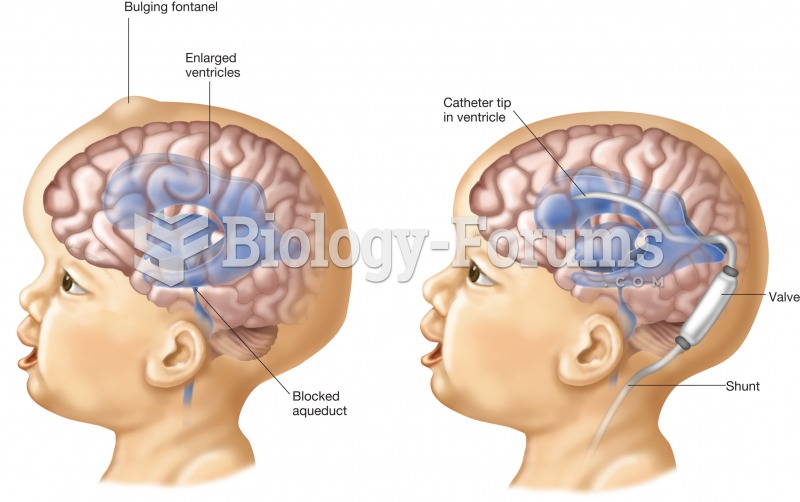 Hydrocephalus. The figure on the left is a child with the enlarged ventricles of hydrocephalus. The
 Mobilize hand and wrist joints. Apply scissoring to knuckles and figure-8s to fingers. Holding the ...
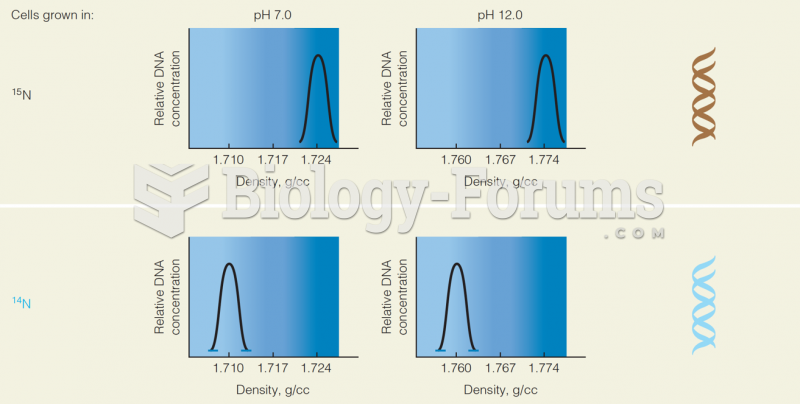 Cell Grown in 15N and 14 N: Graph of Relative DNA Concentration Vs. the Density
 Figure and Ground
 Sketch a graph of the function h(x), by hand on the following interval:
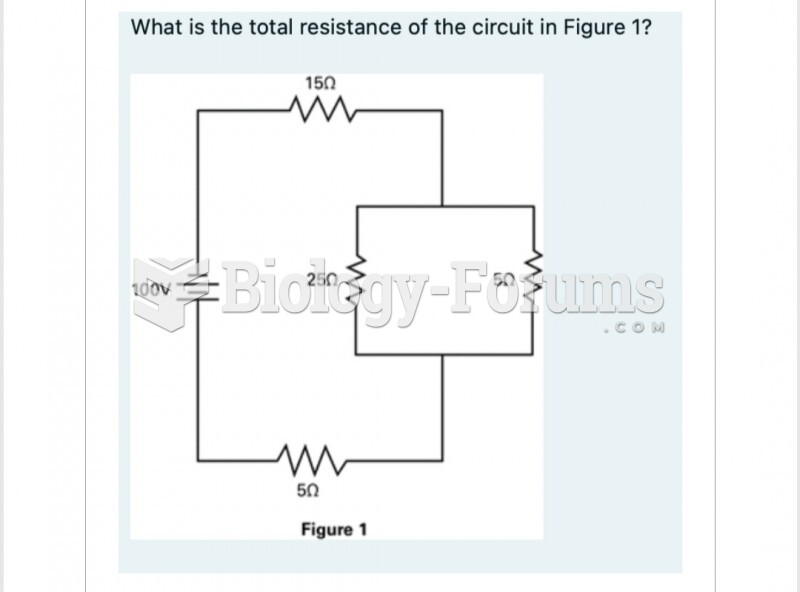 What is the total resistance of the circuit in Figure 1? 150