|
|
|

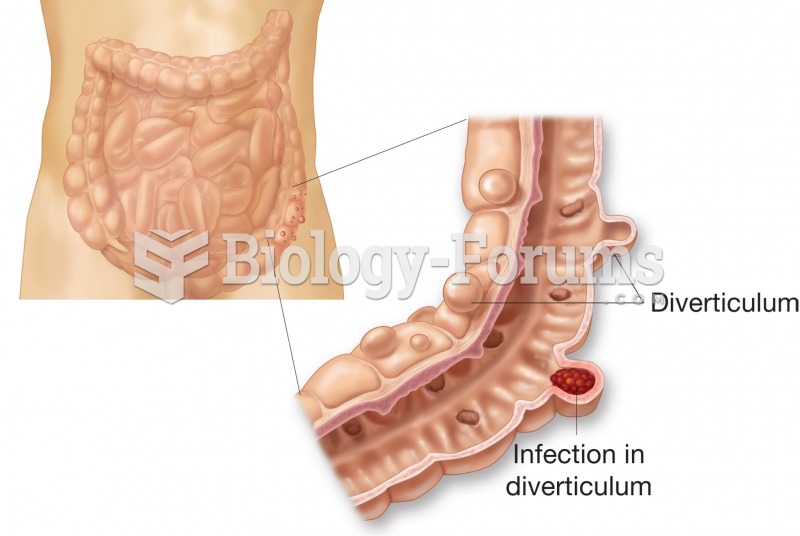 Diverticulosis. Figure illustrates external and internal appearance of diverticula.
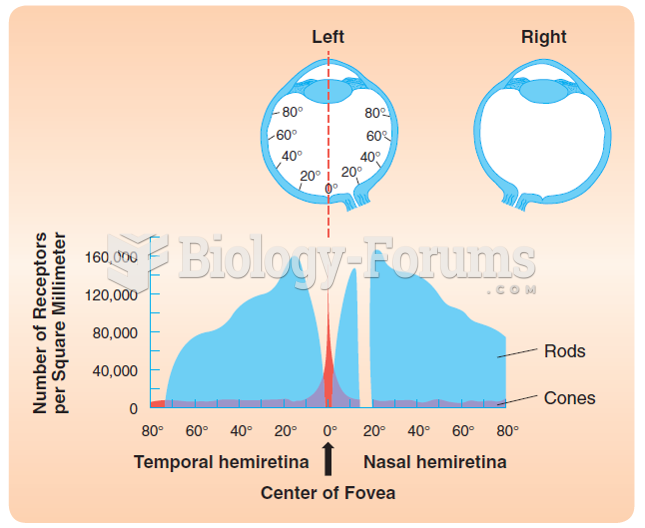 The distribution of cones and rods over the human retina. The figure illustrates the number of cones ...
 Positive velocity graph
 How to graph quadratic equations that are in factored form y=a(x−r)(x−s)
 How to sketch a graph of a function using calculus only (Part 3)
 Punnett square of the dihybrid cross shown in Figure 3.8. There are two combinations of dominant and