|
|
|

 Male killer whale depicted in St Mary's in Greifswald, Germany, 1545
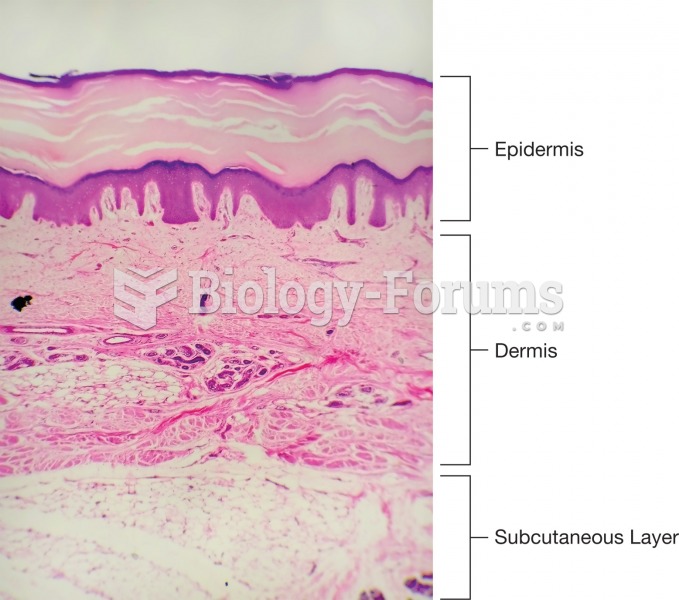 Photomicro graph showing the three layers of the skin.
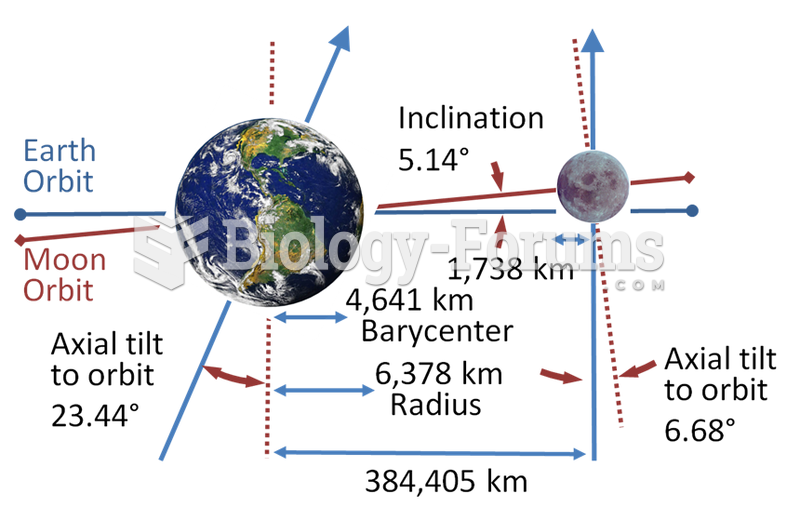 Schematic of the Earth–Moon system (without a consistent scale)
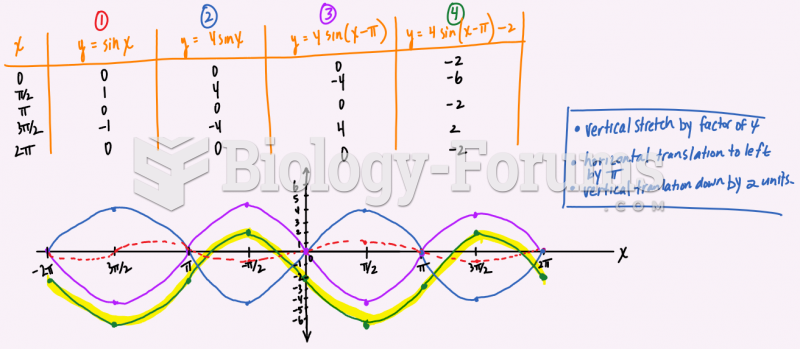 State the transformations on the function f(x)= 4sin(x-pi)-2 and then graph two cycles below.
 How to find the possible equations of a graph?
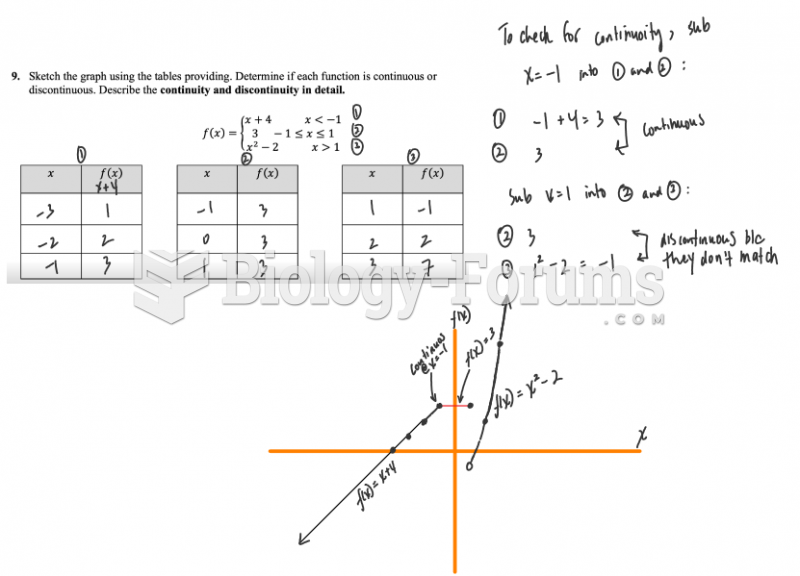 Sketch the graph using the tables providing. Determine if each function is continuous or ...