This topic contains a solution. Click here to go to the answer
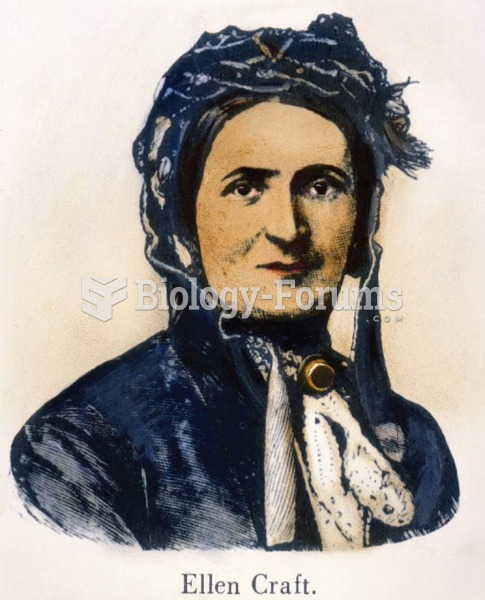
Author Question: A cross-section graph can show how economic variables for different groups of people vary over time. ... (Read 127 times)

fbq8i

  • Hero Member
  • *****
  • Posts: 527
A cross-section graph can show how economic variables for different groups of people vary over time.
 
  Indicate whether the statement is true or false

Question 2

The tables above show the marginal costs and benefits from production of paper. If the efficient level of output is achieved by imposing a tax on paper producers, the government collects tax revenue equal to
 
  A) 64,000.
  B) 56,000.
  C) 72,000.
  D) 48,000.


Related Topics

Need homework help now?

Ask unlimited questions for free

Ask a Question
Marked as best answer by a Subject Expert

Smiles0805

  • Sr. Member
  • ****
  • Posts: 305
Answer to Question 1

FALSE

Answer to Question 2

D


fbq8i

  • Member
  • Posts: 527
Reply 2 on: Jun 29, 2018
Wow, this really help


ashely1112

  • Member
  • Posts: 347
Reply 3 on: Yesterday
:D TYSM


Did you know?

Since 1988, the CDC has reported a 99% reduction in bacterial meningitis caused by Haemophilus influenzae, due to the introduction of the vaccine against it.

Did you know?

Cytomegalovirus affects nearly the same amount of newborns every year as Down syndrome.

Did you know?

If you could remove all of your skin, it would weigh up to 5 pounds.

Did you know?

Street names for barbiturates include reds, red devils, yellow jackets, blue heavens, Christmas trees, and rainbows. They are commonly referred to as downers.

Did you know?

The heart is located in the center of the chest, with part of it tipped slightly so that it taps against the left side of the chest.

For a complete list of videos, visit our video library