A graph shows the price of a pound of cucumbers on the vertical axis and the quantity of new cars sold by GM on the horizontal axis. The price of a pound of cucumbers remains constant as the quantity of new cars sold increases.
The graph of these data is A) a horizontal line.
B) a vertical line.
C) a curve with a maximum.
D) a positively-sloped line.
Question 2
The above table gives data for the nation of Sueland. What is the private sector balance?
A) 11 billion
B) -11 billion
C) -43 billion
D) 43 billion

 Sea cucumbers
 The geomagnetic polarity time scale shows how Earth’s magnetic pole has changed through geologic tim
 Shope’s Model of Young Driver Crash Risks The model shows that many factors contribute to crash ris
 Harriet Beecher Stowe’s novel, Uncle Tom’s Cabin, became a staple of the mid-nineteenth-century thea
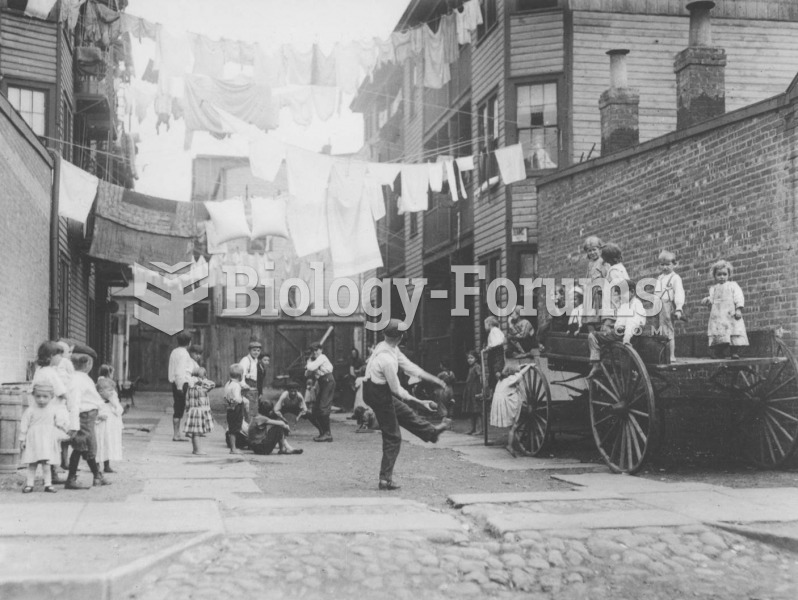 Lewis Hine’s 1910 photograph shows a tenement alley in New York City. More famous for his “unsettlin
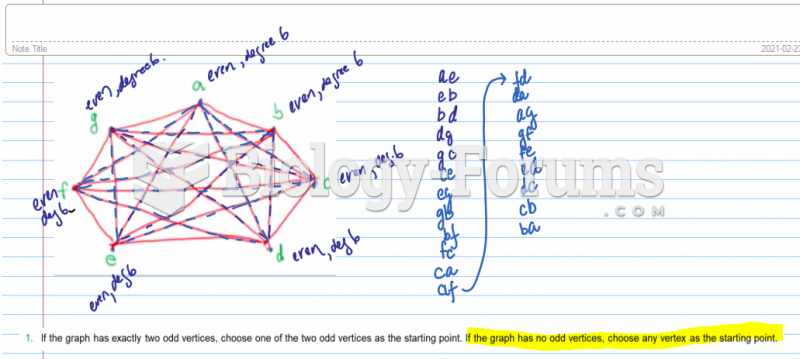 Use Fleury’s algorithm to determine Euler Circuit in the following graph. Exhibit exactly one ...