A graph shows the price of a pound of cucumbers on the vertical axis and the quantity of new cars sold by GM on the horizontal axis. The price of a pound of cucumbers remains constant as the quantity of new cars sold increases.
The graph of these data is A) a horizontal line.
B) a vertical line.
C) a curve with a maximum.
D) a positively-sloped line.
Question 2
The above table gives data for the nation of Sueland. What is the private sector balance?
A) 11 billion
B) -11 billion
C) -43 billion
D) 43 billion

 The salivary glands, parotid, sublingual, and submandibular. This image shows the position of each g
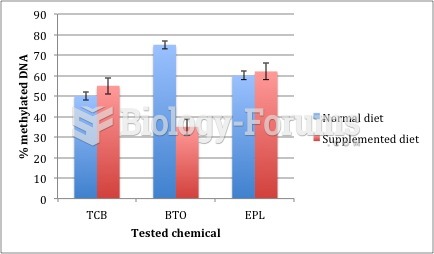 Graph of 3 compounds tested
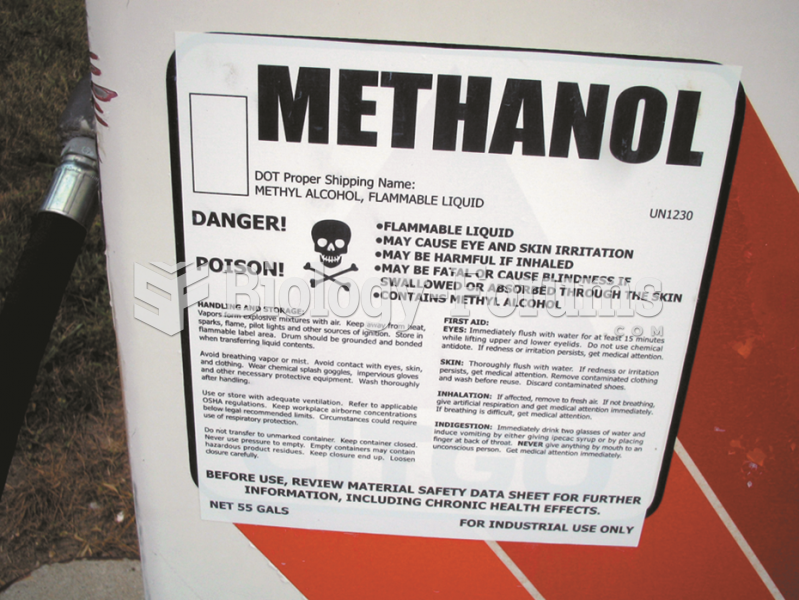 Sign on methanol pump shows that methyl alcohol is a poison and can cause skin irritation and other ...
 Graph this quadratic funcPLtion
 Identify the variable representing each described quantity in the equation
 calculus homework graph help please