|
|
|

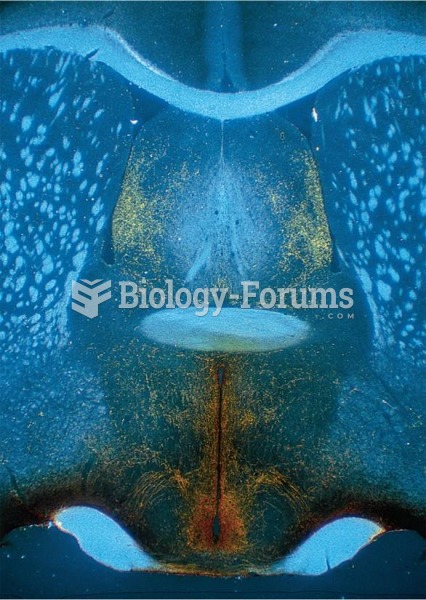 Localization of a Peptide The peptide is revealed by means of immunocytochemistry. The photomicrogra
 That politics was always a rough business is shown in this cartoon, which shows Lincoln, assisted by
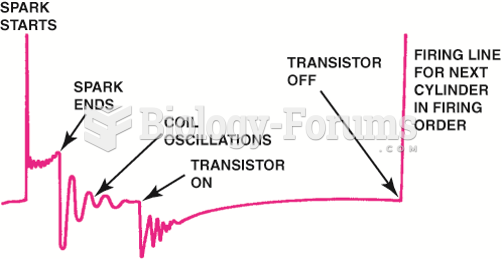 Drawing shows what is occurring electrically at each part of the scope pattern.
 As shown in the figure, a large open tank contains a layer of oil ( density 450 kg/m3) floating ...
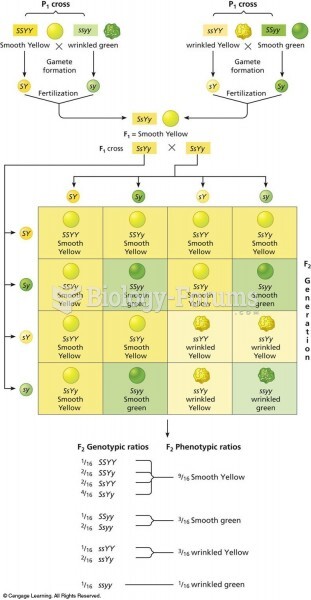 Punnett square of the dihybrid cross shown in Figure 3.8. There are two combinations of dominant and
 For the circuit in Figure 1, assume ideal diodes. The peak inverse voltage is approximately