|
|
|

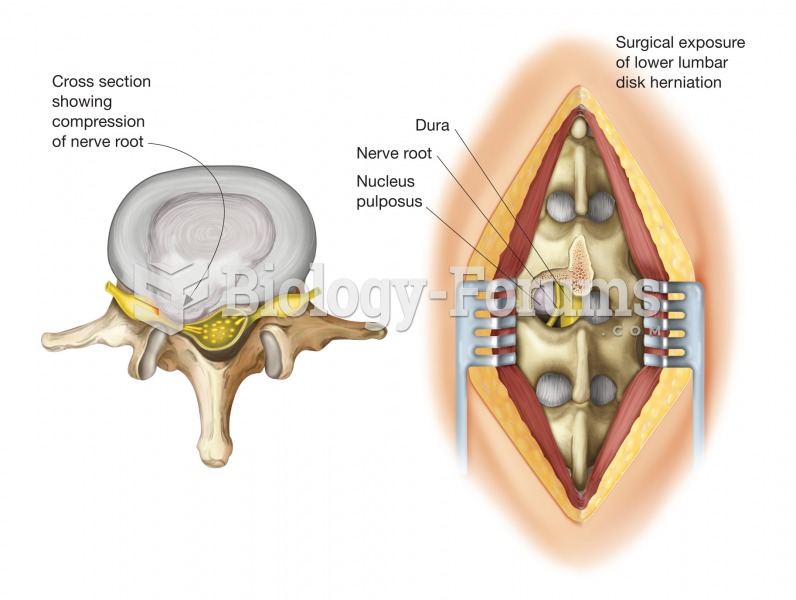 Herniated disk. A herniated disk is a protrusion of the disk’s gelatinous center, called the nucleus
 Human Figure
 Project Management: Achieving Competitive Advantage
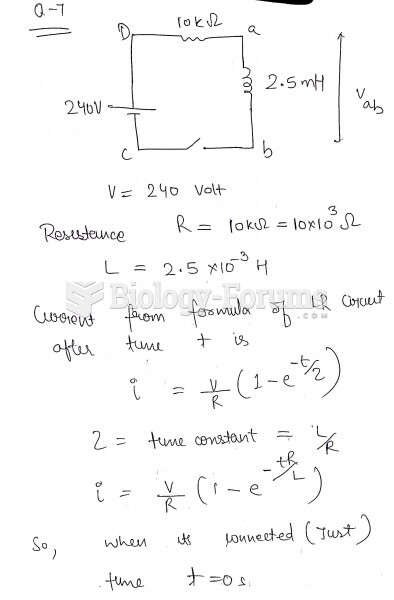 The figure shows an LR circuit with a switch and a 240-volt battery. At the instant the switch ...
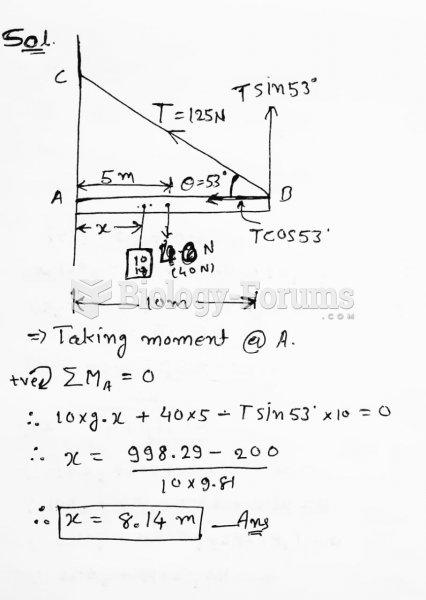 In the figure, a 10.0-m long bar is attached by a frictionless hinge to a wall and held ...
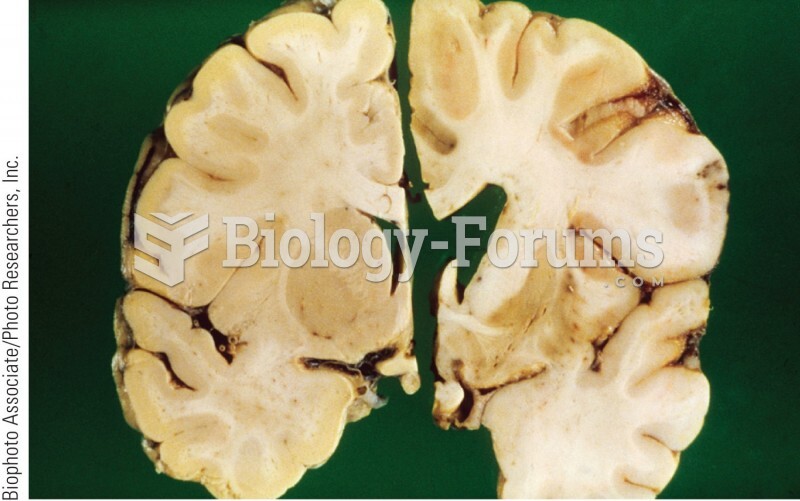 Section of a normal brain (left) and an HD brain (right). The HD brain shows extensive damage to the