|
|
|

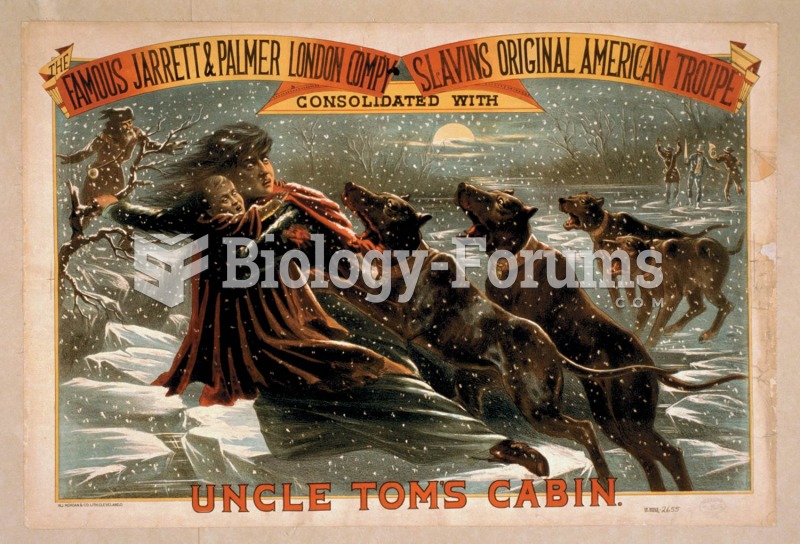 Harriet Beecher Stowe’s novel, Uncle Tom’s Cabin, became a staple of the mid-nineteenth-century thea
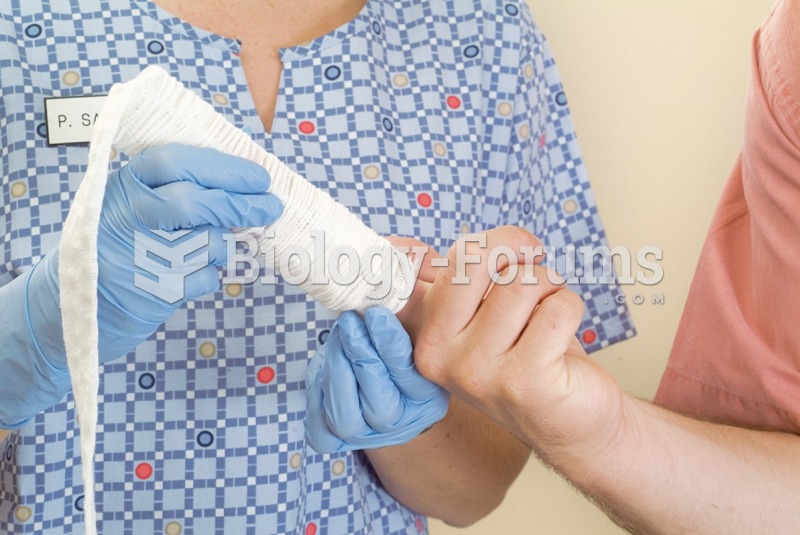 Demonstrate the Application of Triangular, Figure-Eight, and Tubular Bandages
 Sign on methanol pump shows that methyl alcohol is a poison and can cause skin irritation and other ...
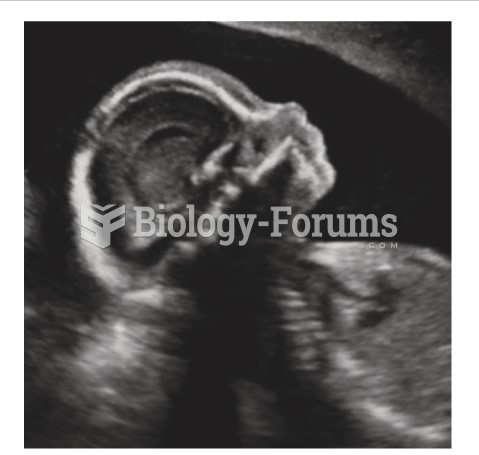 This image shows a normal third-trimester fetal brain
 Competitive firms and maximization
 Thanks giving super mario turkey 2023