|
|
|

 Ocellated turkey
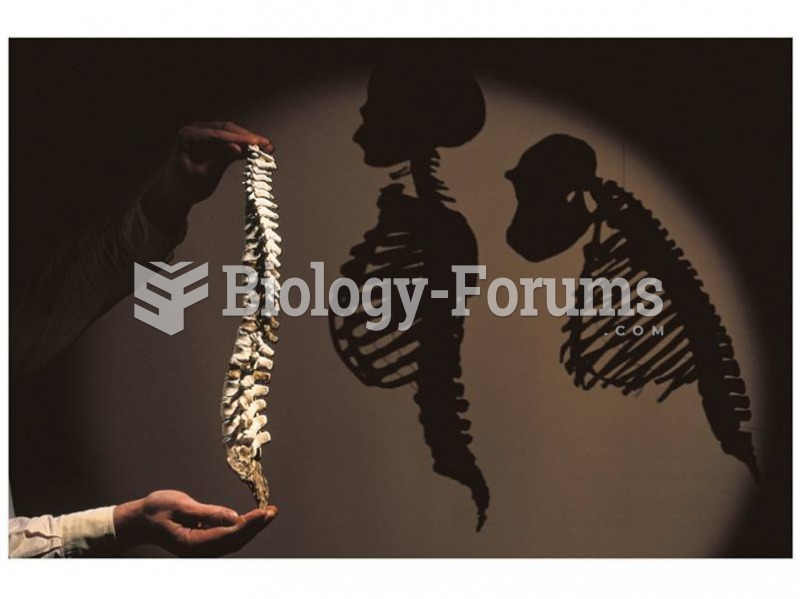 Reconstructed Australopithecus afarensis spine shows that species walked upright.
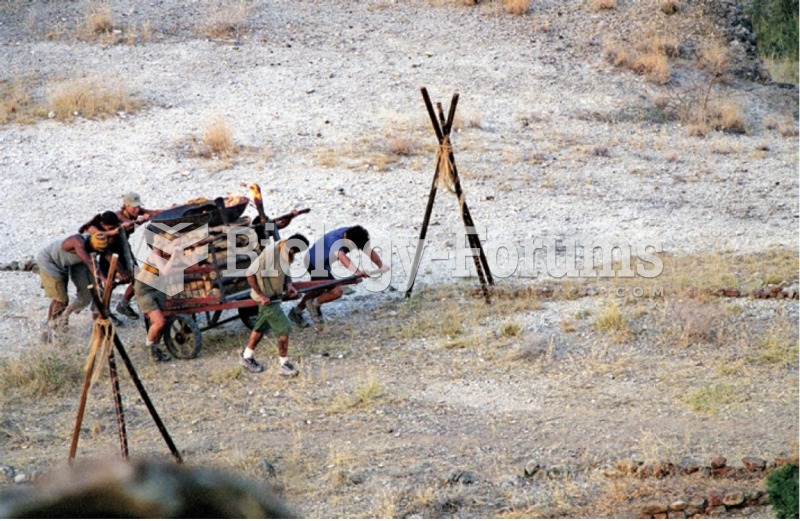 Are reality shows “real”? Does the media tell the “truth”?
 Figure and Ground
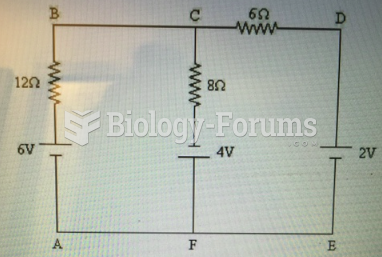 Identify the junction nodes in the circuit shown in Figure 21-1.
 Thanks giving super mario turkey 2023