This topic contains a solution. Click here to go to the answer
|
|
|

 Ulysses S. Grant poses at City Point, Virginia, during the siege of Petersburg.
 The percentage of never-married men and women decreases with age, and by the age of 65, more than ...
 Caravaneer on a camel, China. Tang dynasty, (618–907). Polychrome terra-cotta figure.
 Mobilize the joints in the hand. Follow with figure-8s at the knuckles and scissoring the ...
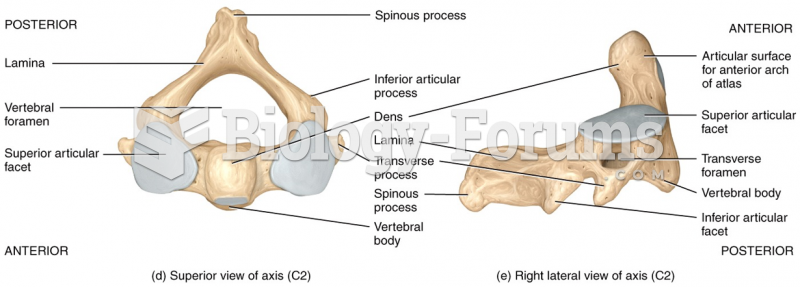 Superior view of axis and right lateral view of axis
 A certain car traveling at 34.0 mph skids to a stop in 29 meters from the point where the ...