This topic contains a solution. Click here to go to the answer
|
|
|

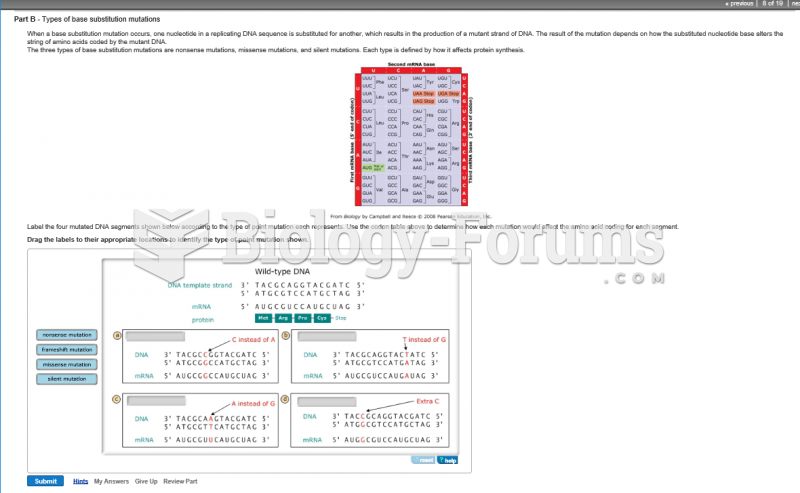 Label the four mutated DNA segments shown below according to the type of point mutation each ...
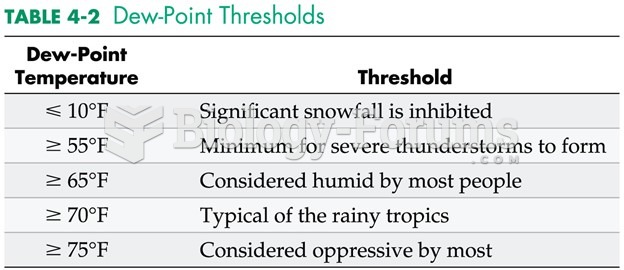 Dew-Point Thresholds
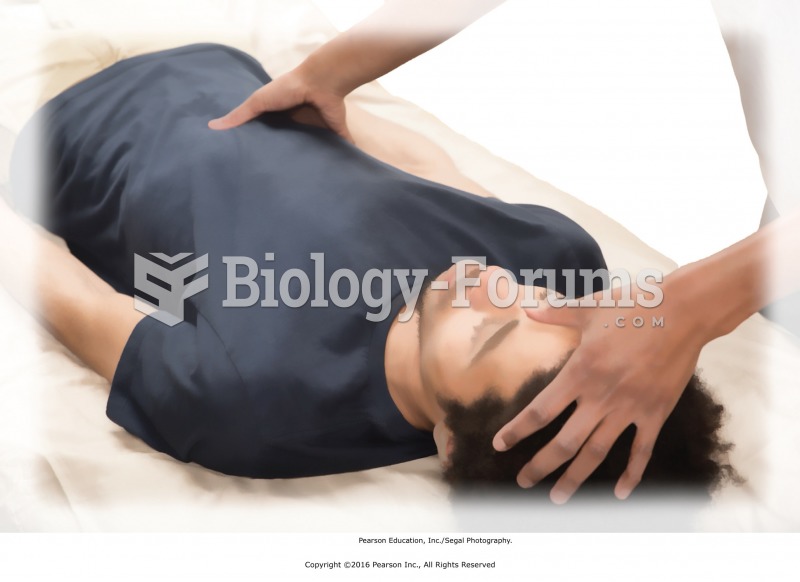 Navel–third eye. Move to the recipient’s right side. Lightly place your left thumb pad between ...
 Figure and Ground
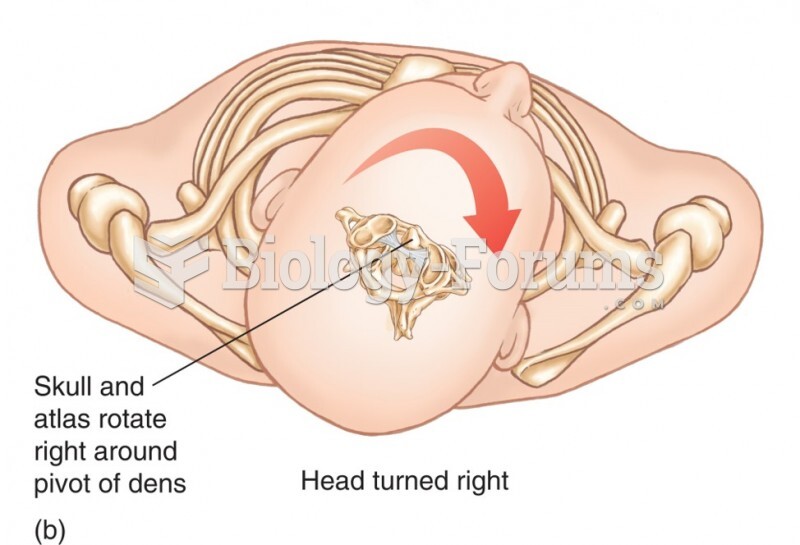 Relationship Between the Atlas and the Axis. The Dens of the Axis Provides a Pivotal Point Around Wh
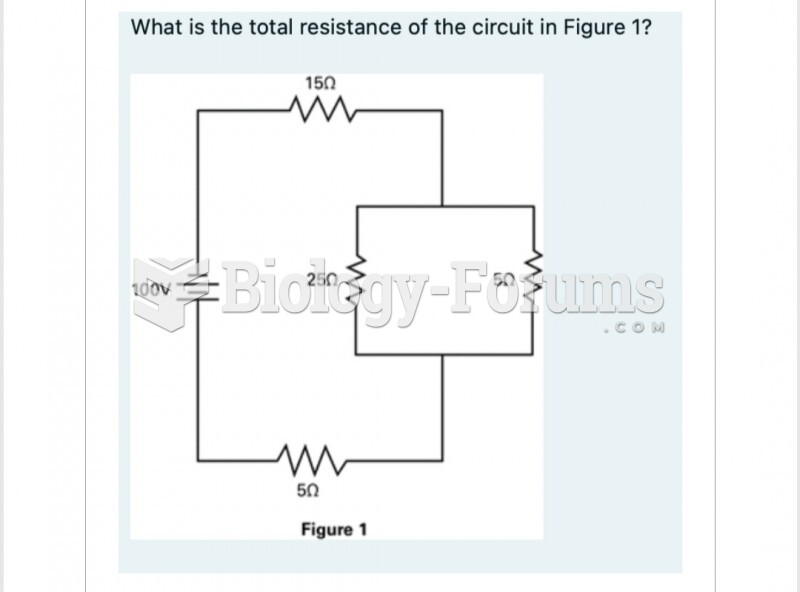 What is the total resistance of the circuit in Figure 1? 150