This topic contains a solution. Click here to go to the answer
|
|
|

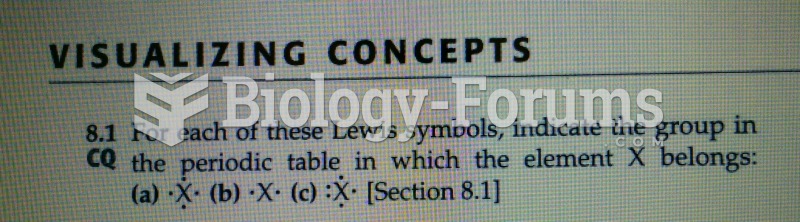 Lewis symbols,(Figure 1)
 Your Culture and Your Point of View
 Demonstrate the Application of Triangular, Figure-Eight, and Tubular Bandages
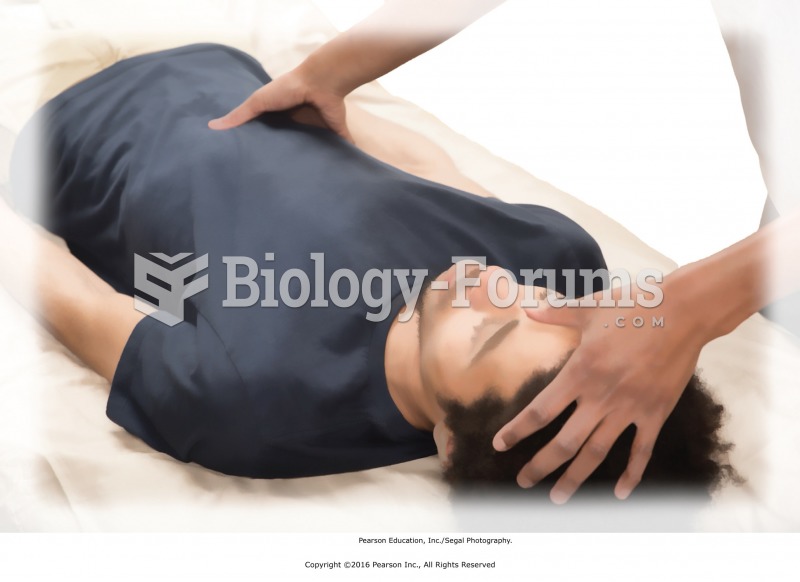 Navel–third eye. Move to the recipient’s right side. Lightly place your left thumb pad between ...
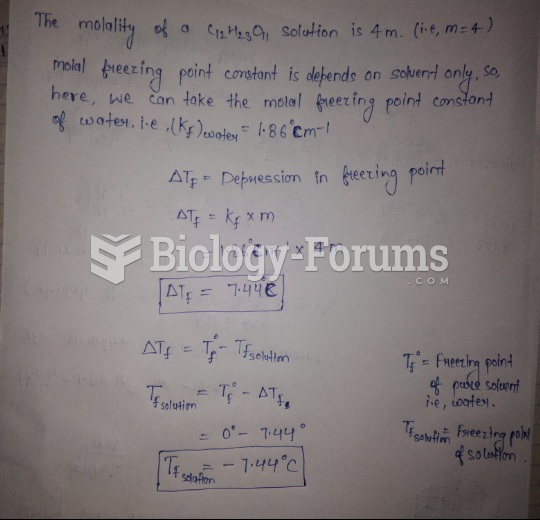 The molality of a C12H23O11 solution is 0.6 m. what is the freezing point of the solution C?
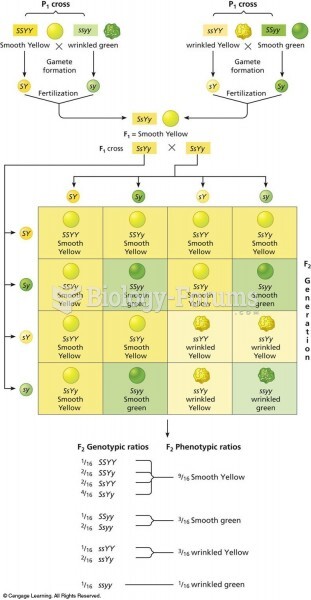 Punnett square of the dihybrid cross shown in Figure 3.8. There are two combinations of dominant and